Food insecurity may also be affected by food accessibility. Those with access to high quality food outlets were less likely to be food insecure (Mayer, Hillier, Bachhuber and Long, 2014). We measured food access in the Loudoun County and northern Virginia area using three indicators. These indicators correspond to traditional food retailers, farmers’ markets, and food pantries. Unlike traditional food retailers and farmers’ markets, food pantries usually provide food to vulnerable populations for free or at especially discounted prices.
The regional accessibility indicator is created by examining the main sources of food supply within a specified radius. The three types of food sources analyzed are food retailers, farmers’ markets, and food pantries. To calculate a regional accessibility indicator at the census tract level, we first determined the location within each census tract that we used to measure the distance to food retailers. Instead of using the geographic center of each census tract, we used the geometric center weighted by population density. This is especially important for large census tracts where the bulk of the population may reside in only a small part of the tract. The population weighted centroid was constructed using the Centers of Population for the 2010 Census retrieved from here.
Only food supply sources within a certain radius of the center of the census tract were taken in constructing the food access indices. Households are unlikely to travel beyond a certain distance to food retailers or they may not have access to adequate transportation. The access index was created as follows:
\[\mathcal{A_i} = \frac{\sum\limits_{j=1}^n \frac{1}{dist_{ij}}}{pop_i}\]
where \(A_{i}\) is an accessibility index for each census tract \(i\), \(dist_{ij}\) is the distance from the population weighted centroid for each census tract \(i\) to each food supply source \(j\), and \(pop_i\) is the population for each census tract \(i\).
The access index variable is essentially a count of food retailers within the specified radius weighted by the inverse distance to each retailer. Retailers that are closer to the population center result in a higher access index. The variable is also weighted by population as we ultimately wish to measure food access per person. This population weighting accounts for major differences in rural, suburban, and urban areas.Food Access Maps
The following travel isochrones show areas of Loudoun County and northern Virginia that are within a ten minute drive of a food retailer, farmers’ market, or food pantry. The darker shading of each map represents an overlap between the coverage of multiple retailers, farmers’ markets, or food pantries. Interactive versions of the isochrones maps can be found at the following links: retailer isochrones, farmers’ market isochrones, food pantry isochrones.
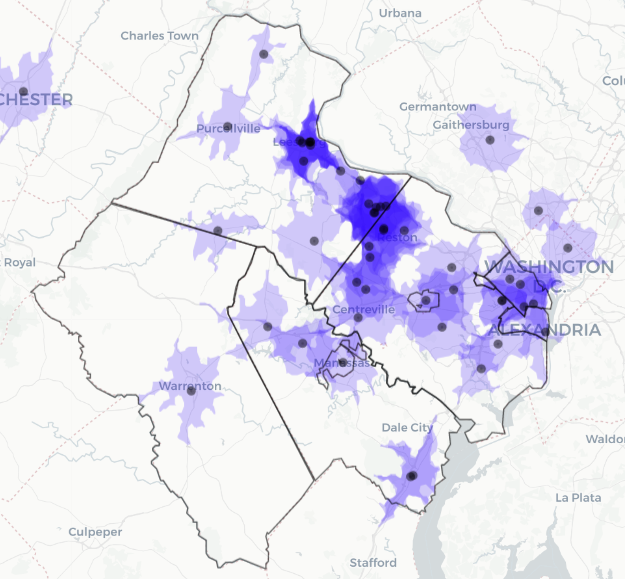


Food Pantries (Blue) - Farmers’ Markets (Red) - Food Retailers (Green)
The travel isochrones can be compared to the percent of the population in the census tract without a car. This map is also available in an interactive format at: car ownership map.
Many of the areas with low car ownership are also in areas with good access to retailers. Access to farmers’ markets is also good in many areas with low car ownership. One exception is the area around Manassas. Food pantries, in general, appear to be well-targeted to these areas as well. The following figures show the food access index variables where the underlying index is constructed using all retailers, farmers’ markets, or food pantries within a 20 mile radius of the population weighted geographic center of the census tract.
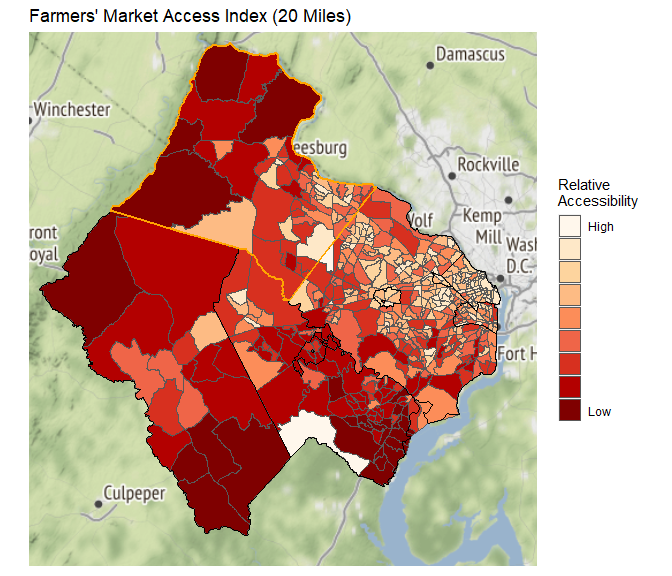
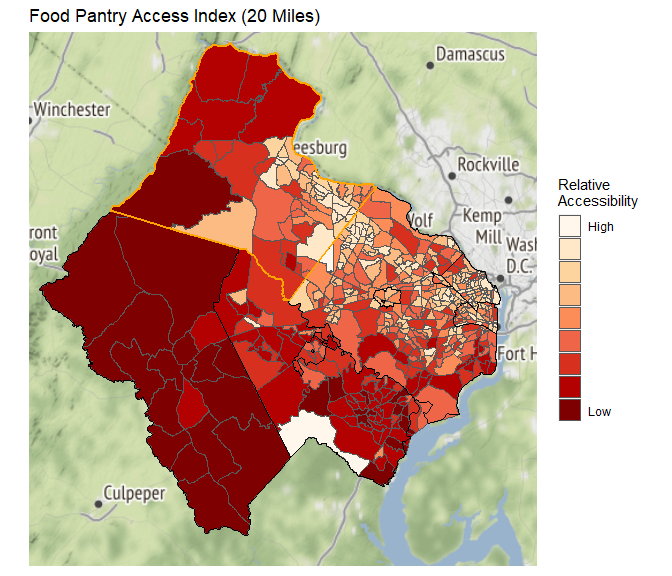
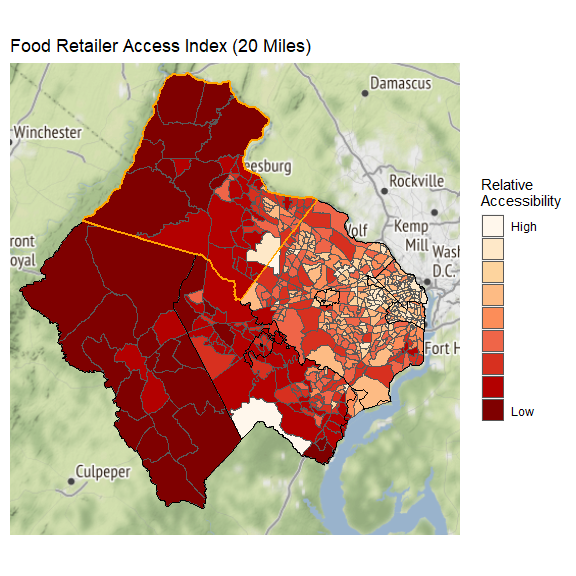
There is less access in rural and suburban areas compared to urban areas. This is especially the case for food pantries. It is important to remember that access is only one aspect that drives food insecurity. In the final part of this project, we combine both food access and social and economic indicators to create a composite index of food insecurity.
References:
Mayer, V. L., Hillier, A., Bachhuber, M. A., & Long, J. A. (2014). Food insecurity, neighborhood food access, and food assistance in Philadelphia. Journal of Urban Health, 91(6), 1087-1097.