Project goals
The goal of this project was to identify areas in Loudoun County and northern Virginia where a potential Loudoun County food hub could alleviate food insecurity. As we have shown in the preceding sections, there are many variables related to food security and these variables are often correlated with one another. In this final section, we construct a single composite index variable for food insecurity which can be used to identify food insecure areas.
Approach
The approach for constructing the composite index is principal component or factor analysis. In this framework, the composite variable is essentially a weighted average of the underlying access and demographic variables. Factor analysis groups together individual indicators that are collinear to form a composite indicator that captures as much of the information common to individual indicators as possible. In essence, it creates unobservable factors from observable data. The individual indicators include:
Food access indicators:
- Food retailer access indicators
- Farmer’s market access indicators
- Food pantry access indicators
Summary demographic variables from CDC SVI 2018 Data Dictionary:
- Socioeconomic index
- Household Composition & Disability index
- Minority Status & Language index
- Housing Type & Transportation index
- Overall social vulnerability index
We first standardized all variables to a common scale before applying the factor analysis. The three factors with the highest loadings were retained in constructing the final index. These factors had 44.7%, 26.7%, and 7.7% of the overall variation respectively and cumulatively 79% of the overall variation. The square of the factor loadings represents the proportion of the total unit variance of the indicator that is explained by the factor. Therefore, we take the proportion of variance explained as our weight. \(F\) denotes the composite index. \(X\) denotes the standardized design matrix. \(L\) denotes the matrix of variable loadings. \(w\) denotes the proportion of variance explained. Then the composite is constructed according to the following formula:
\[F_{n \times 1} = X_{n\times p} \cdot L_{k \times p} \cdot w_{k \times 1} \\ \text{ } \]
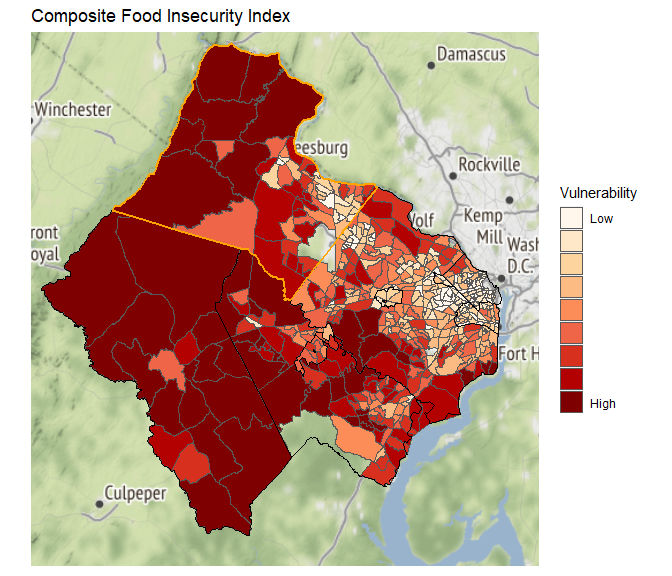
The heatmap of the composite food insecurity index is shown below:
Conclusions
The food insecurity composite map is similar to other access and social and economic indicator maps generated in parts 1 and 2 of this project. We find that the areas with the highest composite score tend to be rural census tracts. However, there can be substantial variation within urban areas. For instance, some census tracts in Leesburg and Ashburn score higher in terms of food insecurity compared to their immediate neighbors. The ability of a Loudoun County food hub to address food insecurity in these areas could ultimately rest on resource allocation that is targeted according to carefully designed insecurity measures. The next steps in this project would be to consider different approaches to index construc tion and robustness to this choice and to take into consideration the types of products that Loudoun County agriculture could deliver to a food hub.
References:
Mulaik, S. A. (2009). Foundations of factor analysis. CRC press.
OECD Organisation for Economic Co-operation and Develop (2008). Handbook on Constructing Composite Indicators: Methodology and User Guide. OECD Publishing.