Geographical Analyses of GitHub Users
This page focuses on mapping GitHub users around the world.
R text analysis/regex matching interactive map network analysisApproach
To analyze GitHub users by different geographical units, we used regular expressions to recode all self-reported location data available in the GHTorrrent data, finding ~770,000 users with valid country codes. In addition to this self-reported location data, GHTorrent also provides latitude and longitude information for GitHub users (assigned using the Open Street Maps API). Drawing on these geocoded data, we aggregated all latitude and longitude information that were within a 2-degree difference. Although this data reduction approach is somewhat crude, the main purpose of this assignment is to cluster users with a common “city code” so that we can examine how users collaborate between more specific geographic units. In turn, we used these city codes to construct networks where nodes represent GitHub users and edges correspond to the number of shared repositories that users can contributed. While 77.23% of the geographic information were originally missing, we were still able to map 488104 GitHub users in our final analyses of GitHub users by city.
GitHub Users by Continent
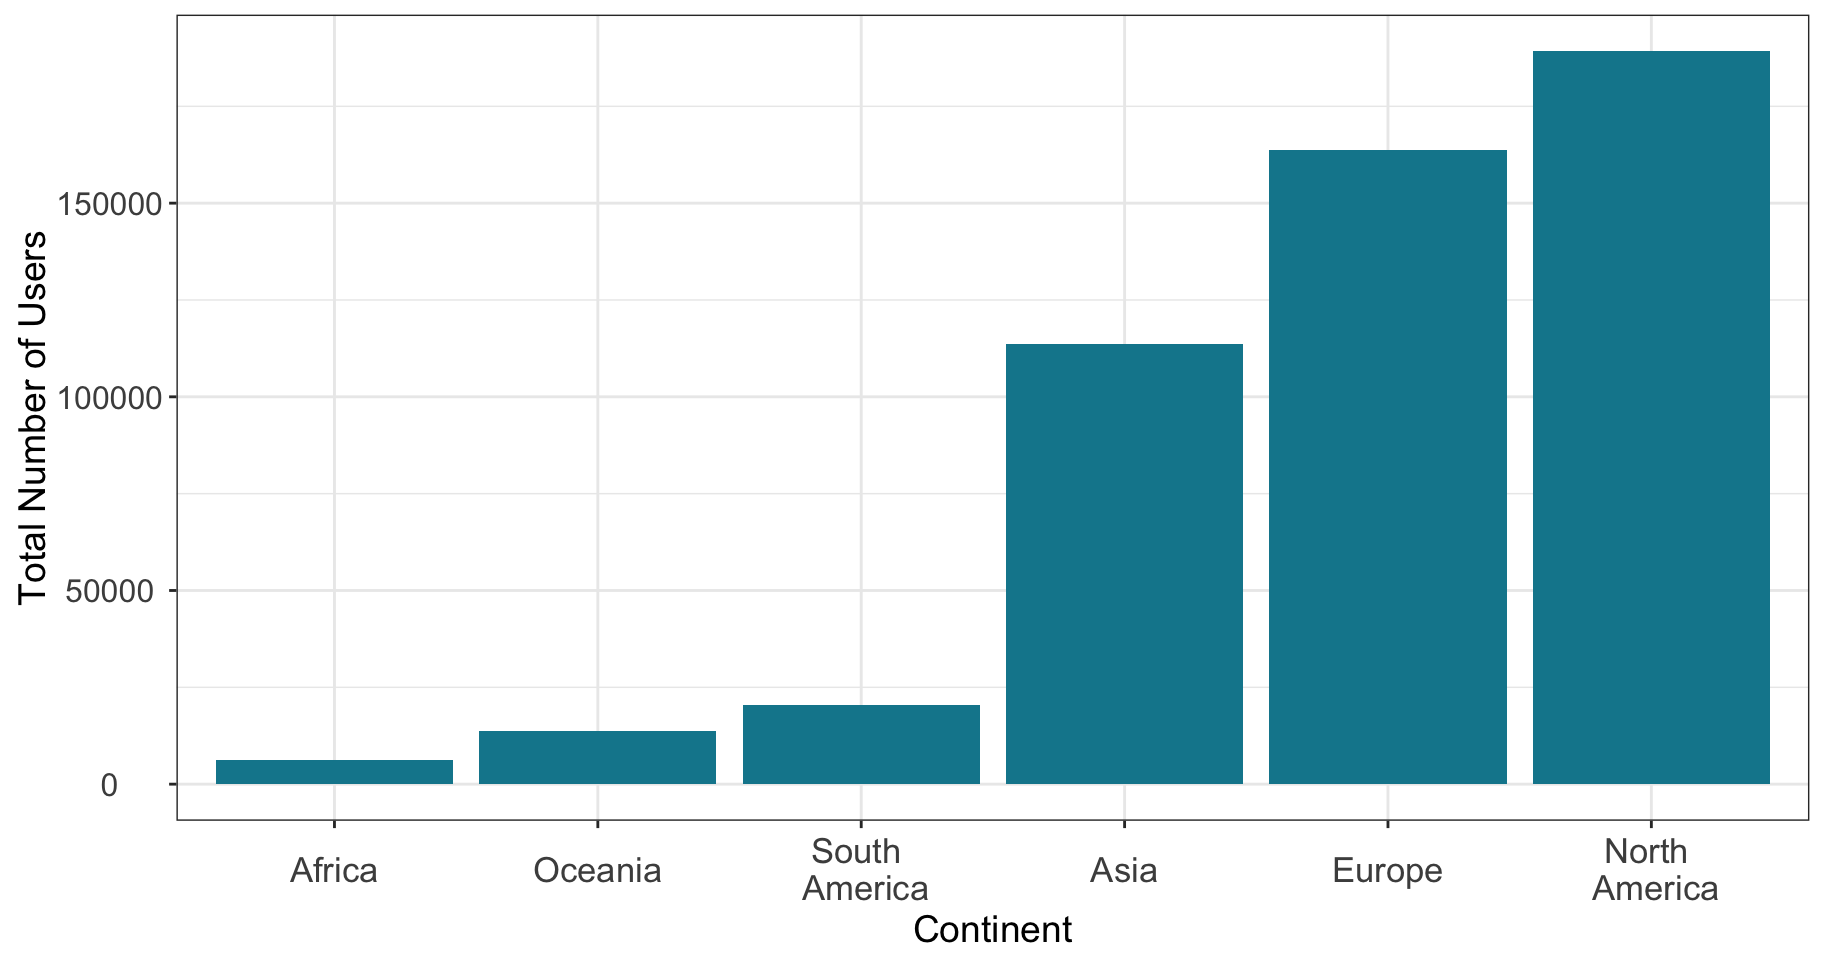
North America is the continent with the highest number of GitHub users - followed by Europe and Asia. This effectively means that almost all OSS is produced within the context of these three continents with South America, Oceania and Africa lagging far behind. In a sense, these results may speak to other measures of global inequities across the world, which may prevent developers in poorer countries for developing OSS. To better understand global patterns of collaboration within the OSS community, we will later reduce our data into six continental networks and investigate collaborations within and across these networks.
Continents Where Github Users are Located
GitHub Users by Country
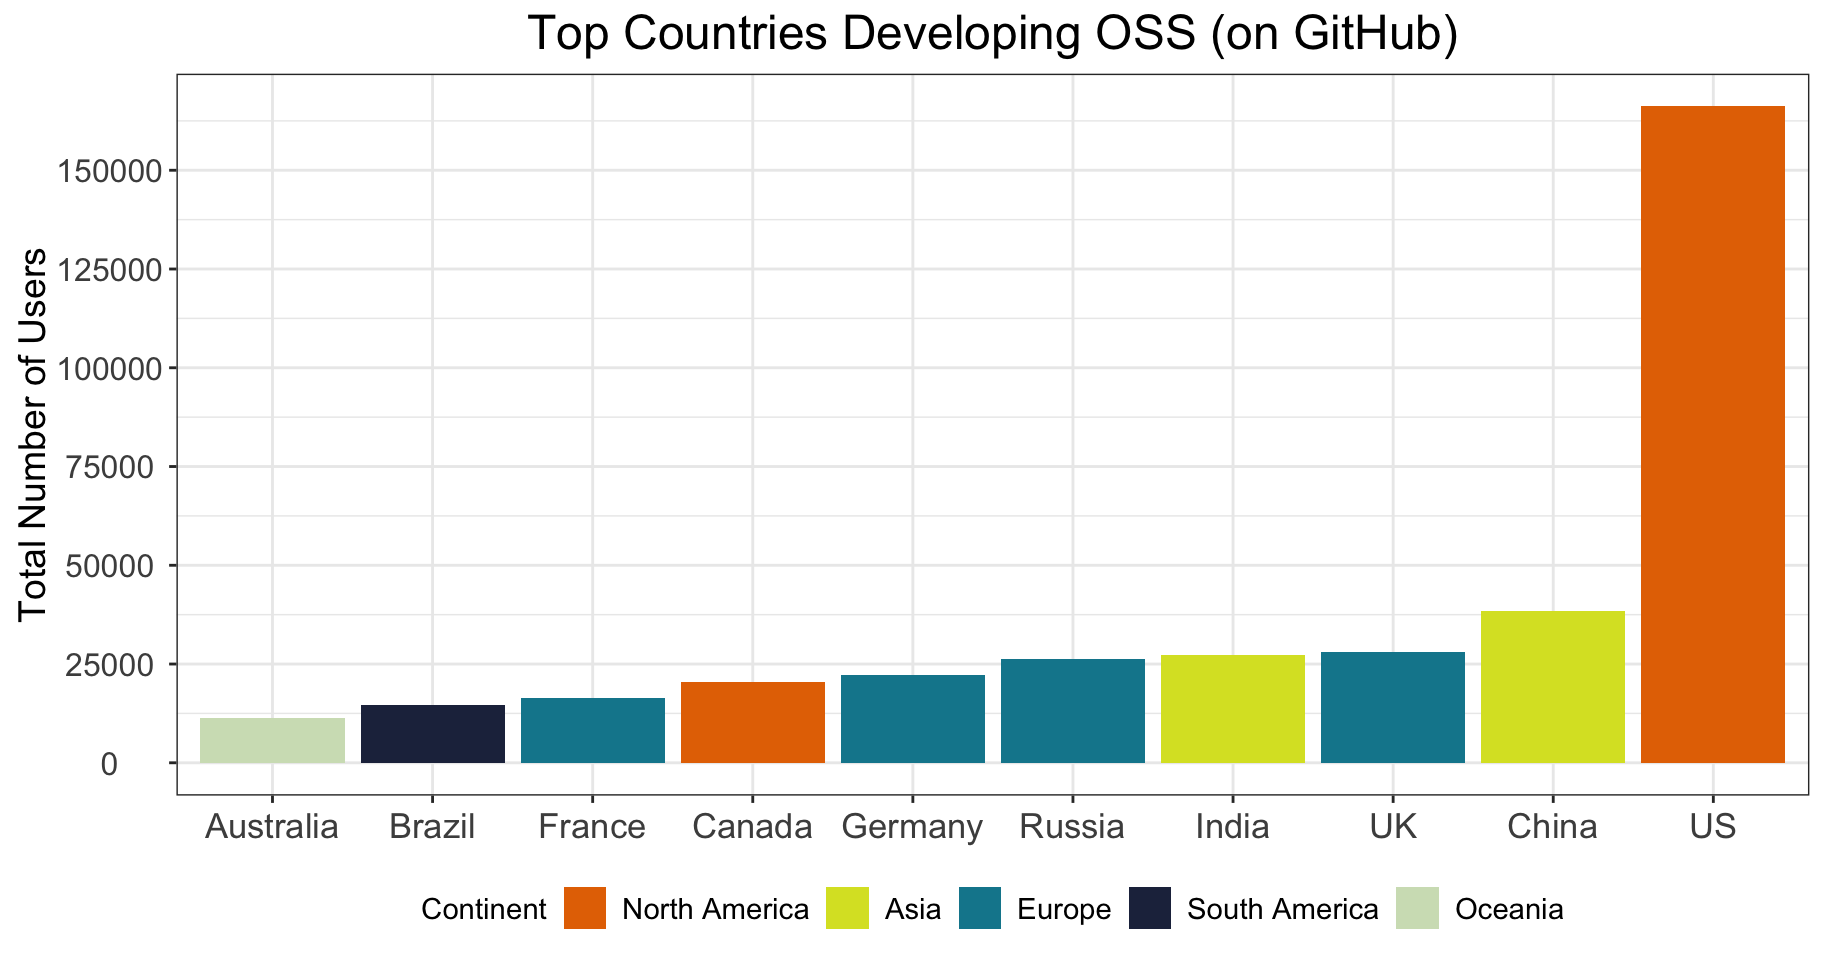
The United States has the highest number of GitHub users (N=166,140) with nearly four times as much as China (N=38,391). This discrepency may be because GitHub started in the US and that other web hosting platforms are used in other parts of the world. On the other hand, these results may also indicate that the US is a global power house in terms of producing OSS software. Of course, as we look further down the graph, we see the difference in overall users are much smaller between the United Kingdom, India, Russia, and the rest of the countries in the top-10. Our team is currently developing a paper that examines historical patterns of international collaboration on GitHub, which will elucidate these preliminary findings in more detail.
Countries Where Github Users are Located
GitHub Users in the United States
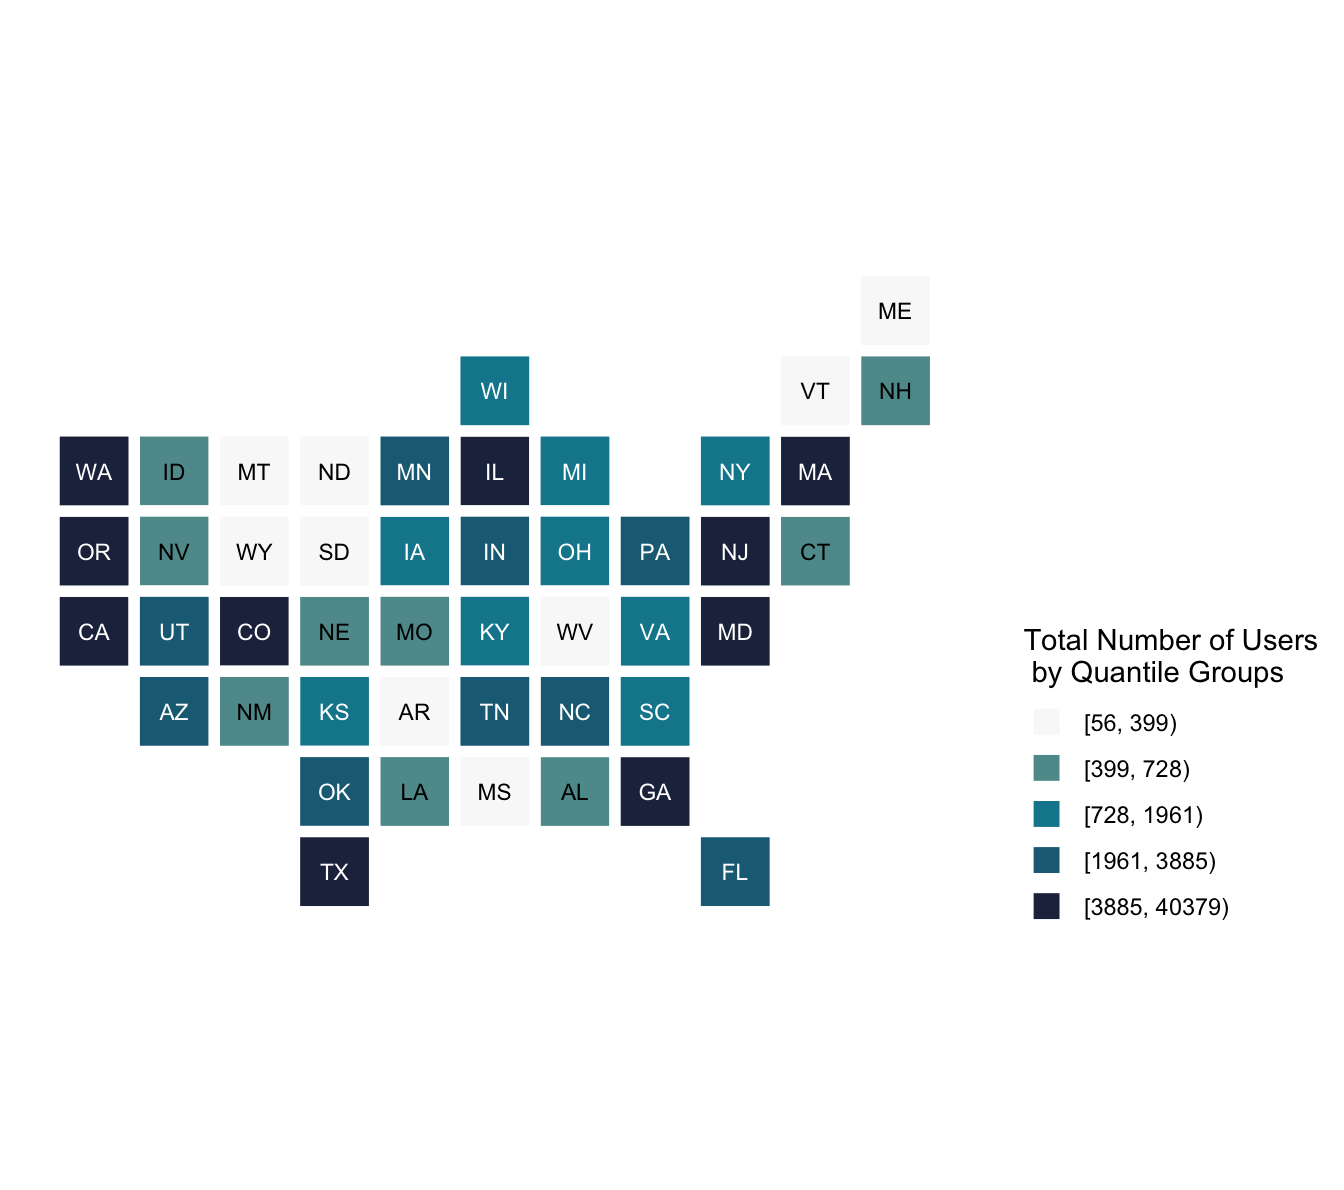
As we mentioned above, the US has the largest number of GitHub users. To get a better understanding of where they are located, we used the statebins package to map users by state. As we see here, GitHub users are mostly located on the West and East coasts with California, New Jersey, Washington, Texas, and Massachusetts being the top-five ranked states. In our future work, we will be looking more into how users across different sectors account for this variation between states. Of course, these maps also point to influence that that major tech hubs, like Silicon Valley in California and Silicon Hills in Texas, have had on the development on OSS.
U.S. States Where Github Users are Located
GitHub Users by City
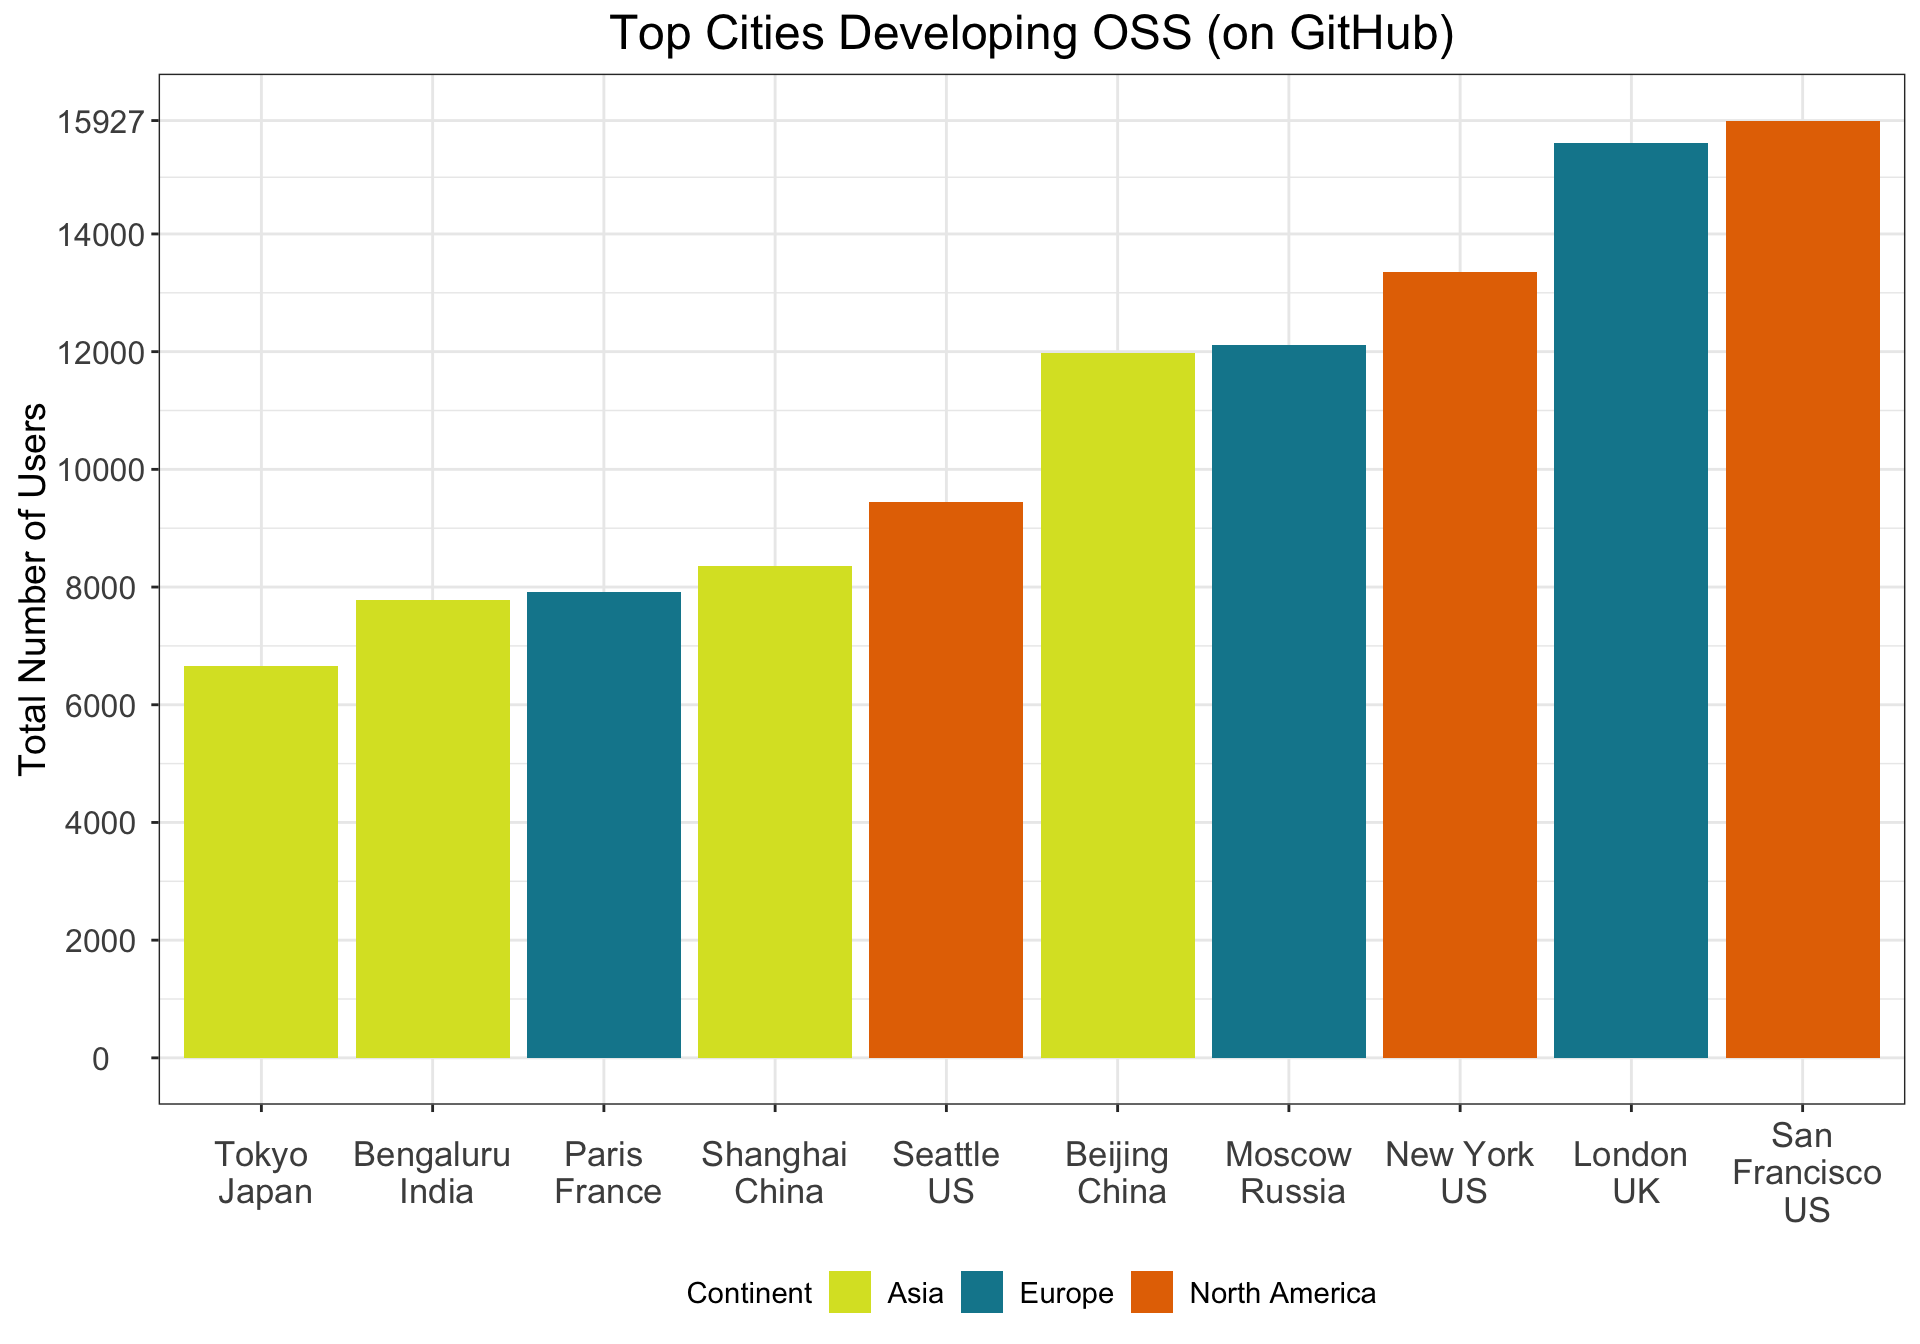
When we looked deeper into where GitHub users are located at the city level, we found that San Francisco (US) is the city with the highest number of GitHub users - followed by London (UK), New York (US), Moscow (Russia), and Beijing (China). Again, these results speak to the importance of the tech industry in shaping OSS development, as San Francisco’s prominence in tech has clearly spilled over into publicly available innovation tools. In our future research, we plan to delve deeper into collaboration networks between these cities. Knowing, for example, how often developers share resources between cities not only tells us where OSS users live but where collaborative ventures might be most successful.
Cities Where Github Users are Located
Interactive Map of GitHub Users by City
In this interactive map, the size of the circle indicates how many GitHub users reported living or working in each city. While the majority of the cities are plotted in blue, we have highlighted the top-10 cities seen above in orange. You can zoom in and hover over the circle to see how many users are in that city or you can also type in a city of interest in the top-right corner. Overall, this map shows clearly that we need to continue looking closer into smaller geographical units when analyzing OSS production.
City-Level GitHub Users Collaboration Network
As we saw previously, the GitHub users in the U.S. is nearly four times as much as those in China, which is the second largest country for GitHub users. However, the top-ten cities came from different countries and different continents.City code, we formulated in this project, enables us to further investigate the the collaboration network between these cities and the open source software collaboration tendency. Previously, the team has been studying the country-level open-source collaboration network on GitHub, and identified users in the U.S. have higher impact on the global collaboration. Now on the city level, we want to investigate what cities in the U.S. are impacting the global collaboration and what cities outside of the U.S. have highest global influence.
In this city-level network, the nodes include all the cities with at least one user collaborating with users in other cities. And in total, we have 8,092 cities in our network. We say that there is a collaboration between two Github users if they are listed as contributors in one licensesd repository. We say there is a collaboration between two cities, an edge in the network, if there is a collaboration between two GitHub users who reside in these two cities respectively. In total, we have 884,455 edges in our network. Our network is undirected, meaning that the edges, collaborations, do not have a direction associated with them.
Before introducing our network, we would like to introduce some network statistics in the GitHub collaboration setting:
- Degree: the number of cities one city collaborates with.
- Weight: total number of shared repositories between two GitHub users.
- Weighted degree: the sum of weights of the edges of nodes.
- Betweeness centrality: calculated by the number of times a city lies on the shortest path between each pair of cities, which identifies the cities that are bridge of two communities.
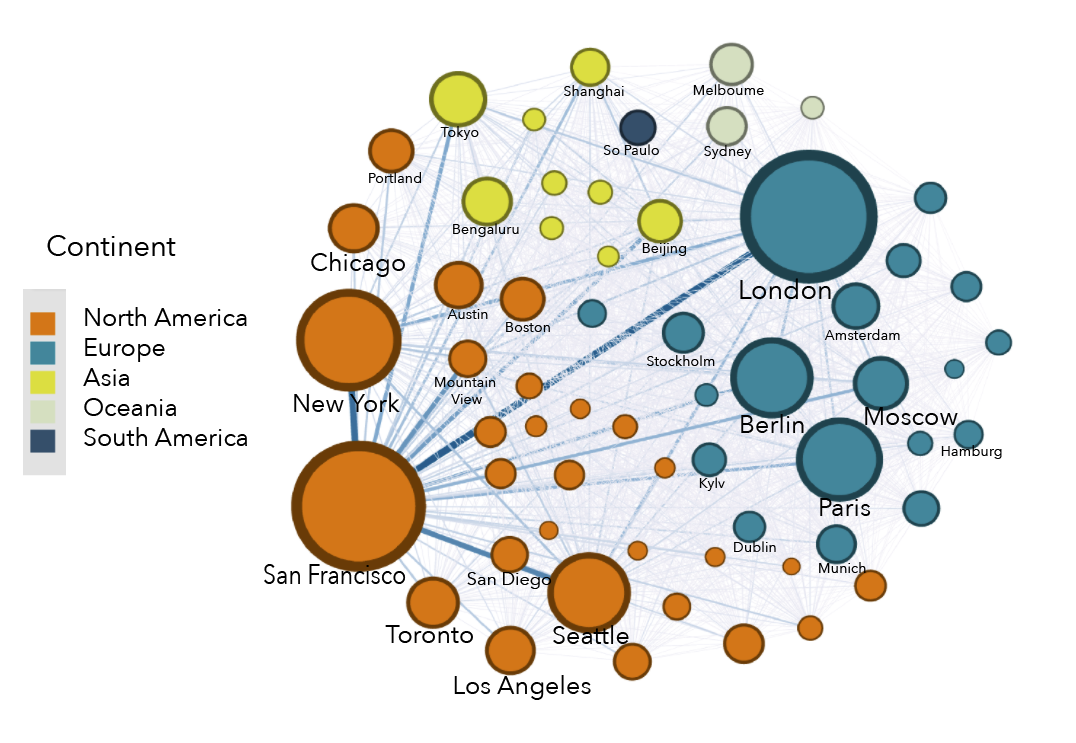
In the following figure, we identified 60 cities with betweenness centrality larger than 158,000. The node size is indicated by its betweeness centrality. The higher the betweeness centrality, the larger the node size are. Varies colors indicate the continent where the cities are located in. The width of the line between two cities indicates the weight between them, which is the total number of shared repositories. San Francisco and London, being the two cities that have the largest number of GitHub users, are also the two cities that have the highest number of collaborations between them. Moreover, having the highest betweenness centrality, San Francisco and London have strong impact in the global collaboration network. North America has dense within-continent network, majorly between San Francisco and New York, Seattle, and Mountain View. It also has large amount of collaborations with Asia and Europe. In the future, we want to further investigate the similarity and differences among these five continent networks seperately.
City-level GitHub Users Collaboration Network by Continent
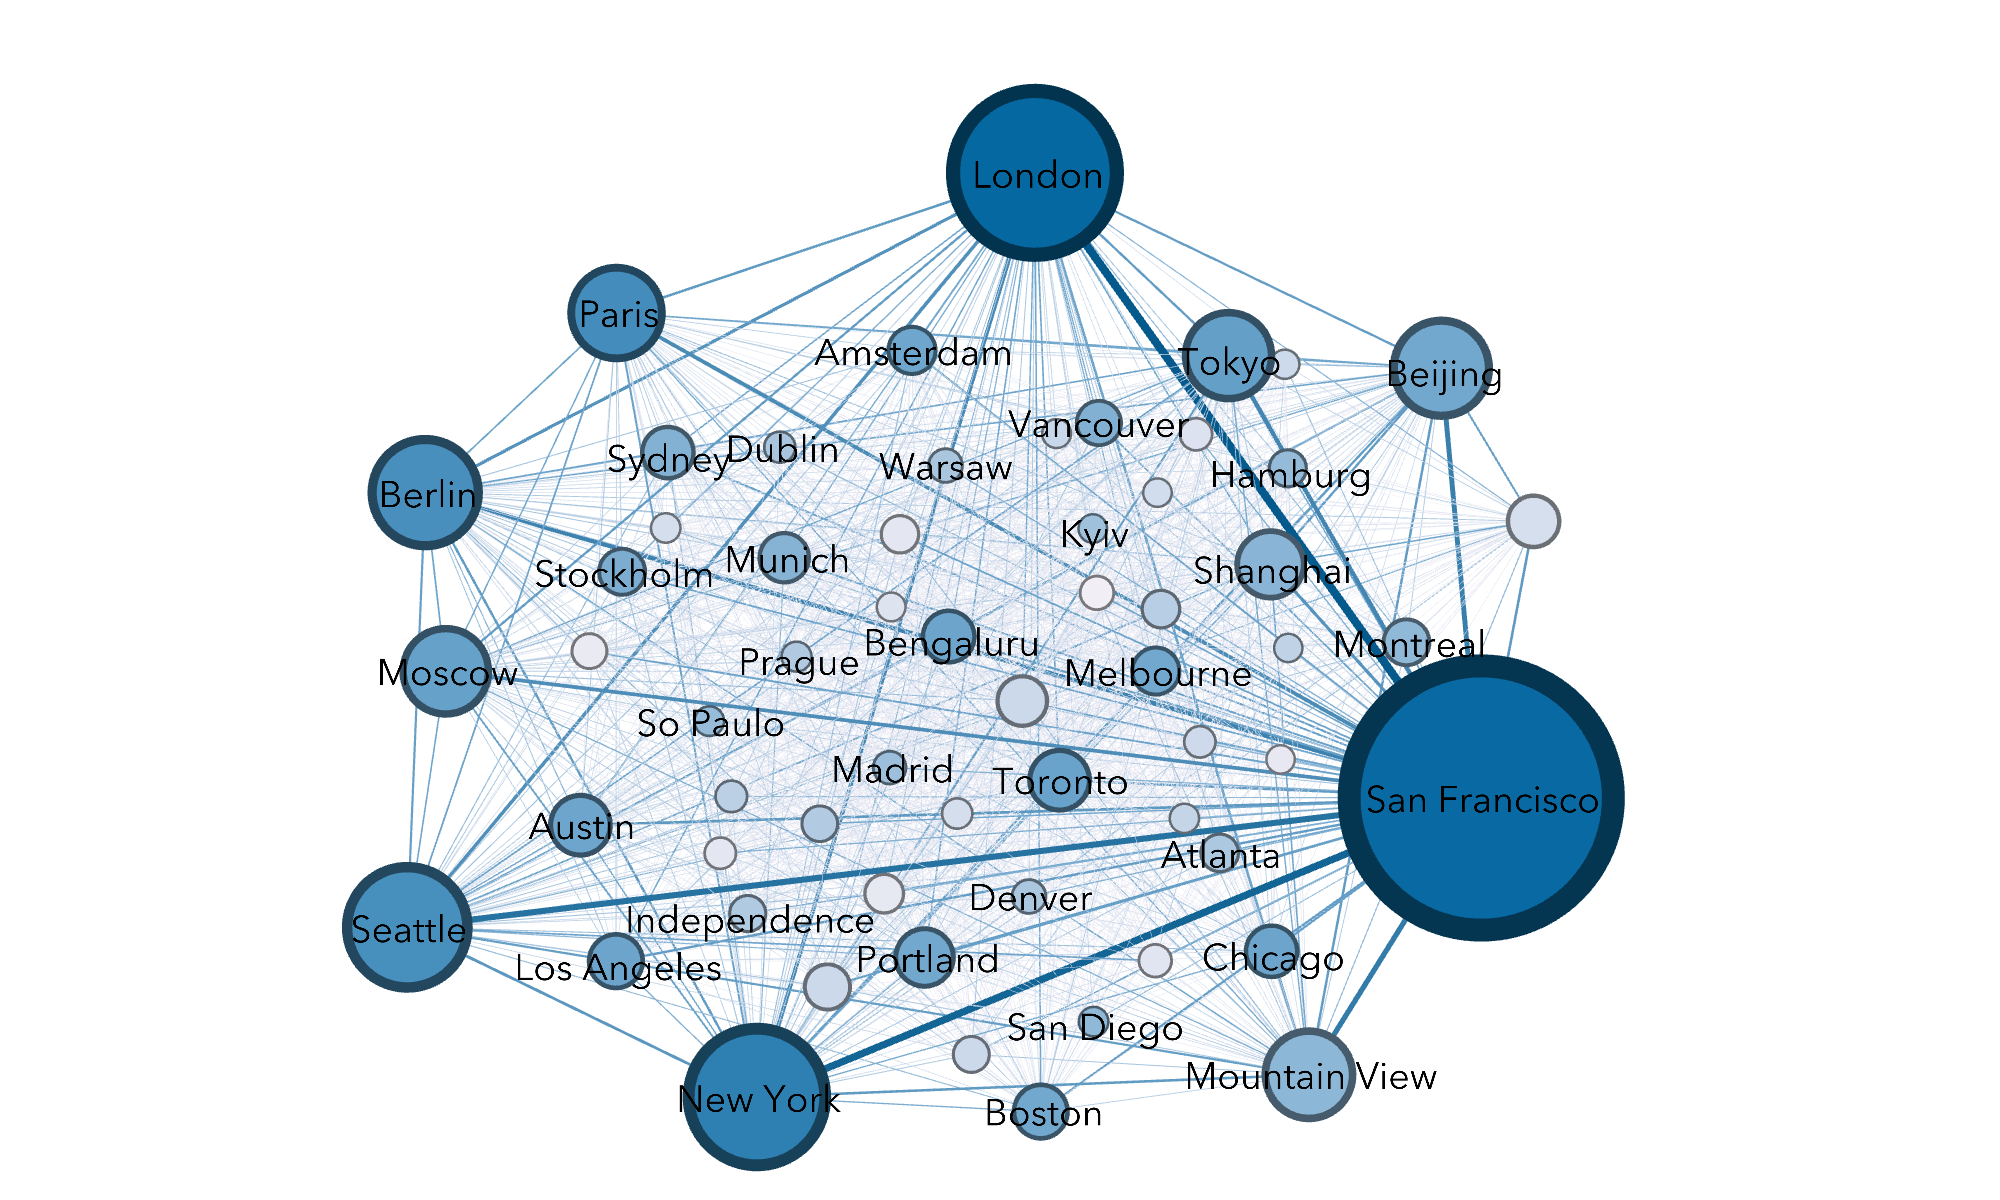
To have a better understanding of the role of cities in the network, we show the comparison between two network statistics: weighted degree and betweeness centrality in the following network figure. These two network statistics reflect local and global influence respectively.
We use the size of the node to reflect the weighted degree. The larger the node size, the higher the weighted degree. A city with a high weighted degree indicates that this city has a lot of direct collaborations with other cities. These cities are identified as influential locally. San Francisco, London, New York, Seattle, Berlin, Paris, and Mountain View, Beijing, and Tokyo are the most influential cities locally, having high weighted degrees.
Meanwhile, we use color gradient of the node to indicate the betweenness centrality, darker the color, higher the betweenness centrality score. A node with a higher betweenness centrality score is more important to be the bridge between two communities in the network. Different from the weighted degree, a high betweenness centrality identifies a city that is influential in the whole network because it accounts for the weight of the neighbors of the neighbors. San Francisco, London, New York, Seattle, Berlin, Paric, Moscow are the most influential cities locally (indicated by weighted degree) and globally (indicated by betweeness centrality). In contrast, although Mountain View, Tokyo, Beijing, and Shanghai have a lot of local collaborations, they serve as less important role in the global network.
Comparison in Local and Global Features of the Network
Limitations and Future Steps
There are a few limitations to our geographic analyses. First, the city code assignment relies on the geocode provided by GHTorrent, which was assigned using the the Open Street Maps API. Before publishing our work to a broader audience, we want to further evaluate the validity of the geocode and compare it with the user-input location. A second known issue is that we have identified users who reported multiple countries in their location responses, but we don’t have multiple geocodes to reflect all of their actual locations. Currently, we count the total number of users recide in each city. However, in our future analyses, we would like to account for the population in each city to reflect the total number of GitHub users per capita.
We presented an overview of the city-level network analysis. Next, we will break down the network into the varies continents. We want to compare the collaboration tendency within each of the continent first and then investigate the between-continent collaboration tendency. We are also interested in learning how the network change overtime.