Main Findings
Factor Analysis and Social and Economic Vulnerability Index
Page county is a rural county in the Valley region in Virginia. While factor analysis and composite index construction have been done on different scales, we are limited by our data to the county-level. However, other social and economic modeling approaches were applied to county level data and were developed to address shortcomings of predecessor models (Cutter et al., 2003). In the factor analysis framework, the composite variable is essentially a weighted average of the underlying access and demographic variables. Factor analysis groups together individual indicators that are collinear to form a composite indicator that captures as much of the information common to individual indicators as possible (Mulaik, 2009). In essence, it creates unobservable factors from observable data.
The social and economic vulnerability index (SEVI) is constructed using county level data on poverty rate, ethnicity, education level, unemployment, SNAP benefits, health insurance, age, marital status and the health and education accessibility measures. All of these factors can affect the level of vulnerability in a county. A few selected variables are graphed below.
We first standardized all variables to a common scale before applying the factor analysis. The three factors with the highest loadings were retained in constructing the final index. These factors had approximate 24%, 21%, and 12.2% of the overall variation respectively, and cumulatively 57% of the overall variation. The square of the factor loadings represents the proportion of the total unit variance of the indicator that is explained by the factor. Therefore, we take the square of the factor loadings as our weight when constructing the composite.
Our model uses a varimax rotation with the maximum likelihood solution method. Using the correlations with the unobserved factors, we use the following formula to construct the composite vulnerability scores.
\[\mathcal{F} = (X^s\centerdot F^T) \centerdot \textbf{w}\]
where \(\mathcal{F}\) is the Composite Score,
\(X^s\) is the Standardized design matrix, \(F^T\) is the Matrix of Factor Scores and \(\textbf{w}\) is the Proportion of Variance Explained.
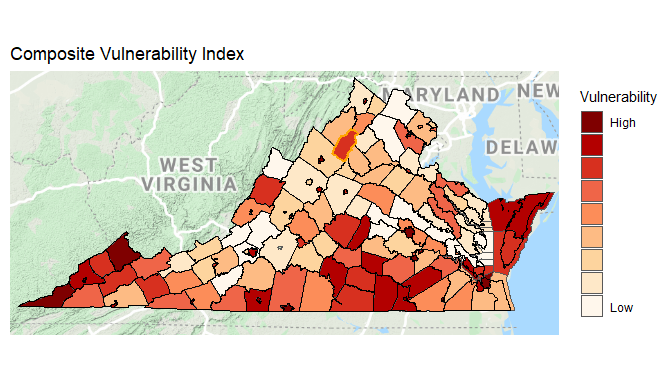
The SEVI is shown in the figure below where darker colors represent more vulnerable populations. The map shows that across Virginia, there are important differences in social and economic vulnerability. Page County especially stands out for its contrast in social and economic vulnerability to the rest of the Northern Virginia Region. While Nova ranks low in vulnerability compared to the rest of the state, the rural regions and Page County specifically rank medium high to high in vulnerability.
Conclusion and Policy Implications
While he SEVI is only one measure in assessing areas that may be in need of targeted assistance, the data displayed from the SEVI as well as the other measures discussed provide evidence that Page County is an outlier in its region of the state. These results could be used by Page County for grant and program applications to better serve its residents for the future. Increased funding and program implementation would mitigate the low accessibility to education and healthcare which fosters growth in employment, income and economic mobility. For Page county, increasing returns in these areas could then lead to decreased social and economic vulnerability.
References
Cutter, S. L., Boruff, B. J., & Shirley, W. L. (2003). Social vulnerability to environmental hazards. Social science quarterly, 84(2), 242-261.
Mulaik, S. A. (2009). Foundations of factor analysis. CRC press.