Impact of Rural Broadband Development Programs
Overview of the Project
USDA ReConnect
The Rural Development Broadband ReConnect Program furnishes loans and grants to provide funds for construction, improvement, or acquisition of facilities and equipment needed to provide broadband service in eligible rural areas. To qualify for the ReConnect program funds, the propsed funded service area (PFSA) must meet three conditions:
- At least 50% of households in PFSA must lack sufficient access to broadband service, which is defined as at least 100 Mbps downstreamand 20 Mbps upstream in the Funding Opportunity Announcement (FOA) published on August 4, 2022.
- The proposed network must be capable of providing broadband service to every premise located in the PFSA at the speed defined by FOA.
- The PFSA must be in a rural area. The area must not in located in a city, town, or incorporated area with a population greater than 20,000 inhabitants or an urbanized area contiguous and adjacent to a city that has more than 50,000 inhabitants.
The evaluation of applications also prioritizes the economic needs and social vulnerability of the communities. The exact criteria can be viewed on USDA website.
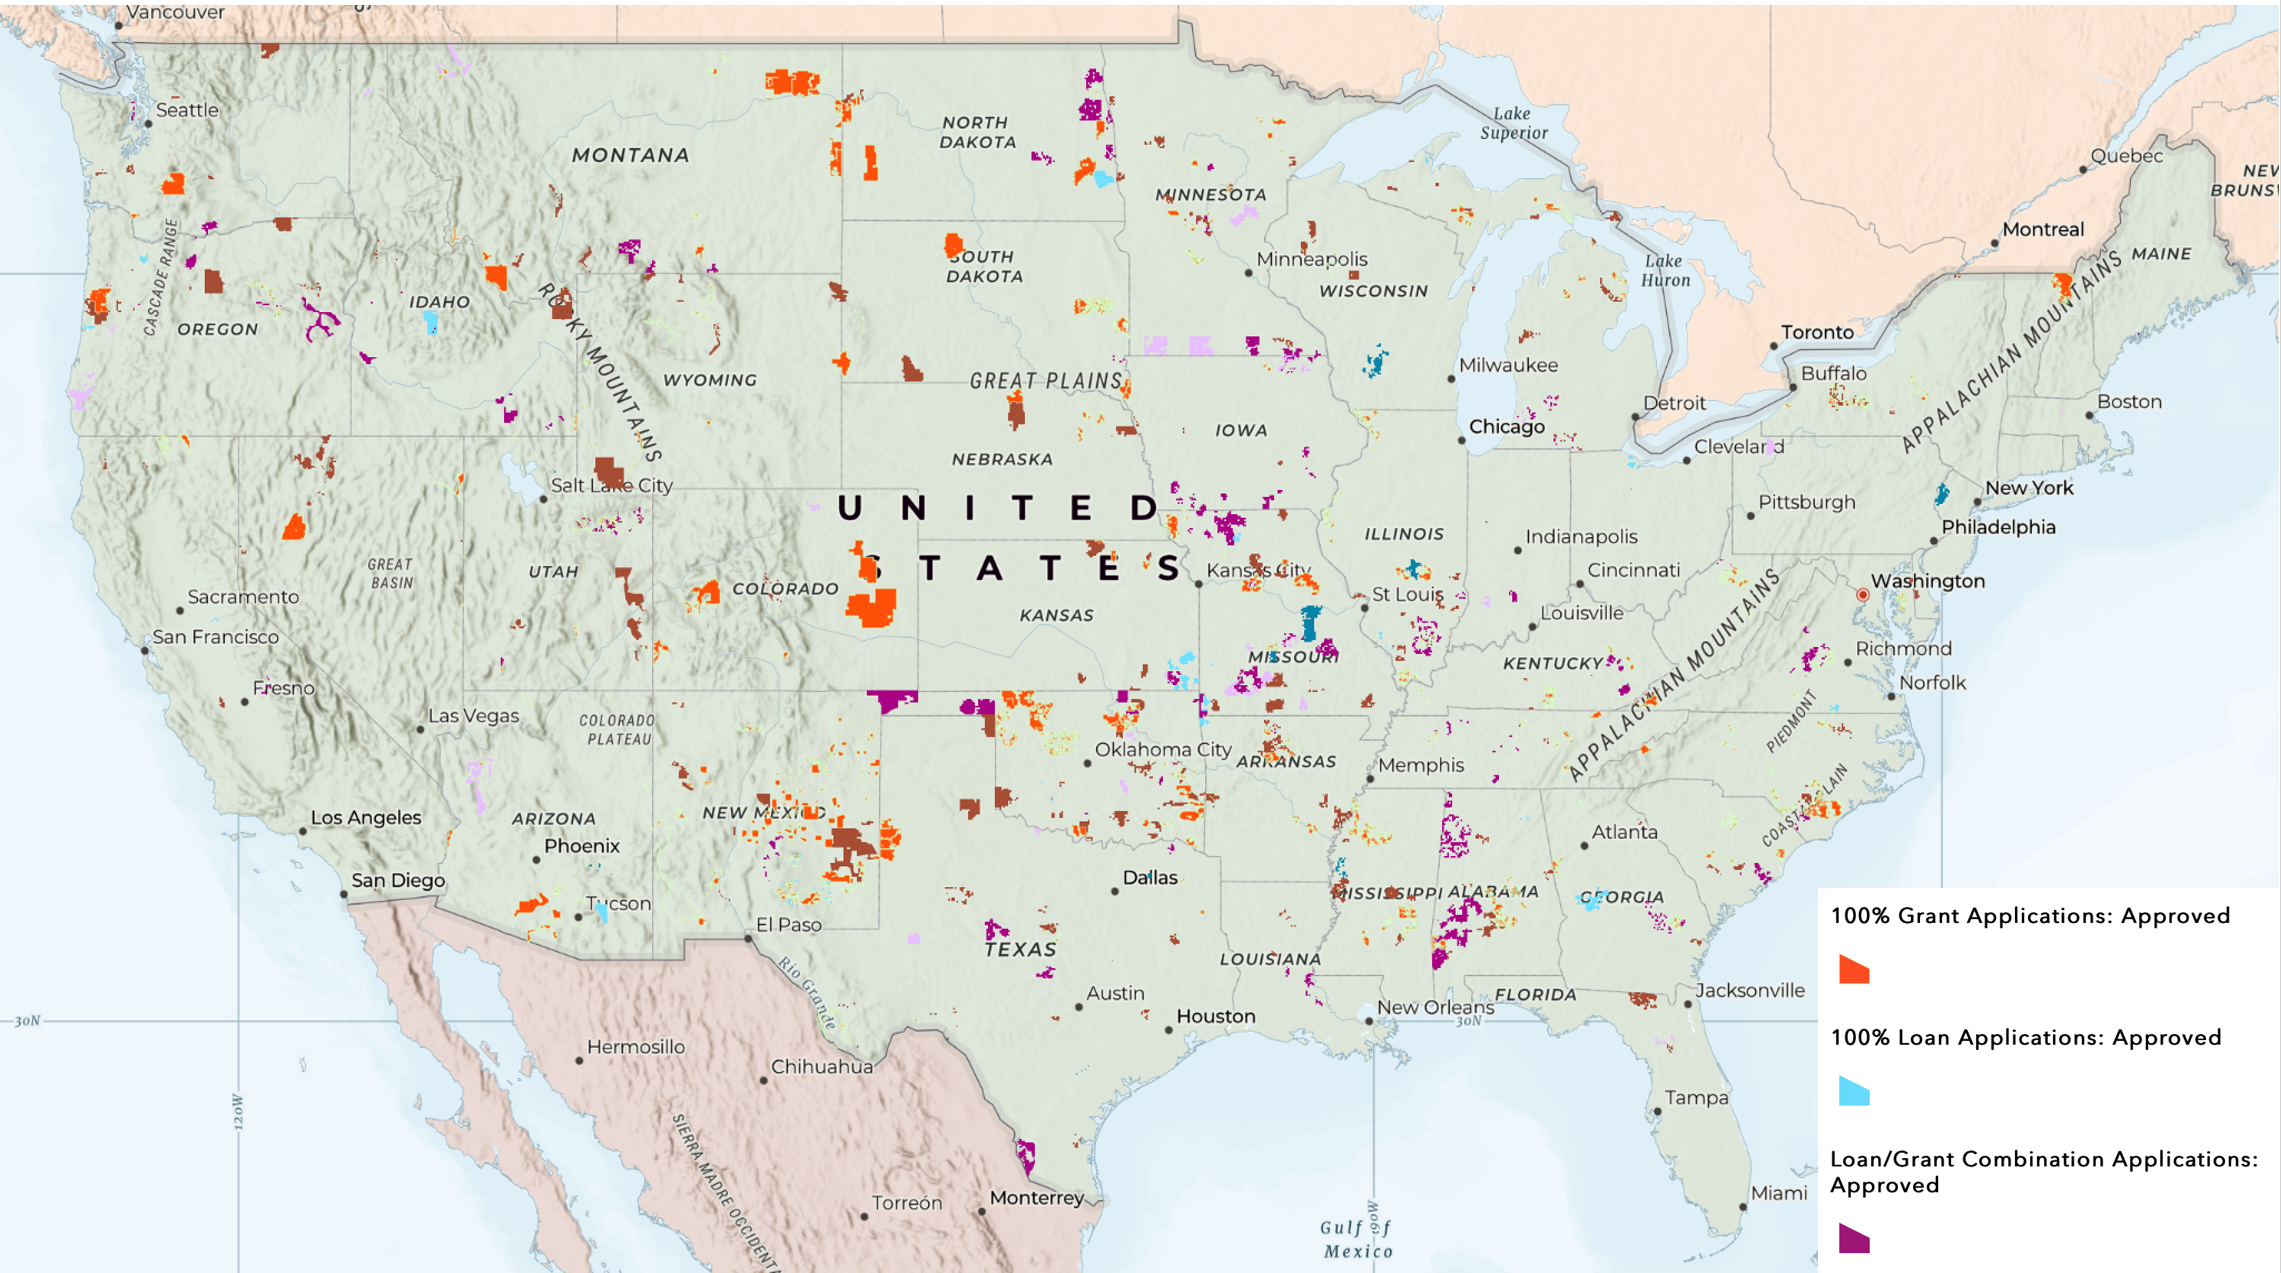
To date (August 1, 2023), USDA has funded three rounds of ReConnect program, with the fourth round on-going. From FY2019 to 2023, a total of 316 projects are approved and $3.86 billion are invested across the nation to provide affordable broadband connections for rural communities.
Project Goals
Broadband investment is a high priority for the Administration and Congress, and over 3 billion dollars have been invested in the ReConnect program. Yet, little research has been done to investigate the program’s effect. The goals of our project are three-fold.
- Improve the data quality of household-level datasets through geocoding and web scraping
- Assess the impact of a completed ReConnect project on internet speed
- Create a workflow that can be scaled nationally and reproduced for other projects across the country
Methodology
We use the difference-in-difference approach to determine the improvement in internet speed. In other words, we compare the internet speed of the treatment group and the control group before and after the completion of the project. There are two major challenges in this approach and we bring in the following four datasets to address them.
| Dataset | Level | Key Contents | Year |
|---|---|---|---|
| BlackKnight Property Data | Household level | Housing characteristics (e.g. number of bedrooms), address, coordinates | 2021 |
| ReConnect Subscription Data | Household level | Subscription speed, address, coordinates | 2021 |
| Ookla Speed Test Data | 620m by 620m tiles | Average speed and number of tests within each tile, geometry of tiles | 2019 - 2022 |
| Federal Commission of Communication(FCC) Broadband Data | Census block level | Broadband providers, maximum advertised speed for each provider within each census block | 2019 - 2021 |
Challenge in matching households
We believe that housing characteristics will influence the internet connectivity of each household. For example, families in more valuable houses are more likely to afford higher internet speed. To control for these factors, we introduce BlackKnight property data into our analysis. With BlackKnight data, we are able to 1) access the housing characteristics of the subscribers and 2) find matching households correspondingly to use as the control group.
Challenge in determining the internet speed
Although we have the subscription speed for the subscribers (i.e., the treatment group) in the project area after the project completion, we do not have the same information for the control group or the treatment group before the project completion. We want to build a predictive model with the subscription speed being the dependent variable so that the model can be used to predict internet speed when such information is unavailable.
The challenge now is choosing the appropriate predictors. Ideally, Ookla speed test data can serve as a strong predictor as the plot below indicates. For the subscribers within the Ookla tiles, the test speed shows a strong positive correlation with the subscription speed.
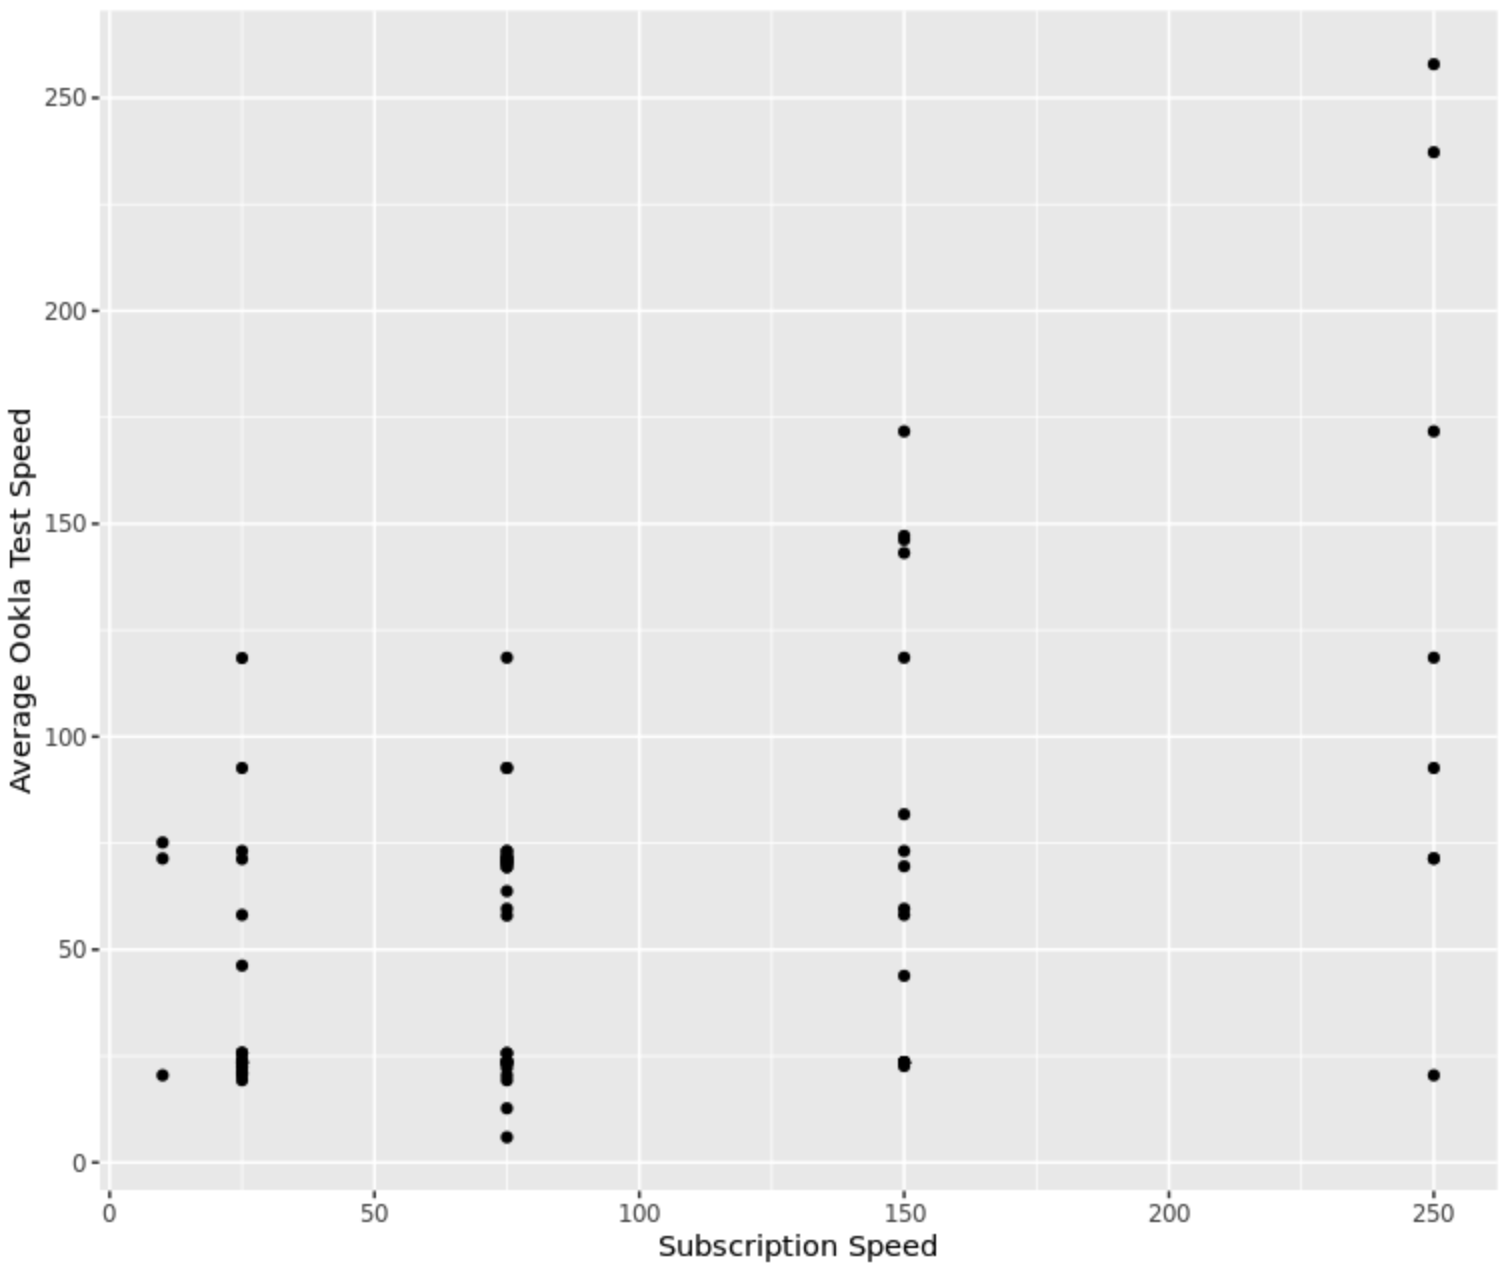
Yet Ookla speed test data suffers from self selection, which means the lack of speed test data doesn’t necessarily tranfer to the lack of internet connection. To address this, we apply a kernel smoothing function to impute the Ookla speed. We then use the imputed Ookla speed test data, FCC data and housing characteristics(number of bedrooms, number of bathrooms, building area, property age, assessed property value) as the explanatory variables. The regression model will then be used to predict the internet speed in the treatment and control group before and after the project completion.
|
|
|
Program Contacts: Joel Thurston and Cesar Montalvo |