COVID-19 Symptoms
Can we use EMS data to identify COVID-19 trends?
Background
While we were obviously interested in identifying patterns in COVID-19 symptoms across demographic groups, time, and space, this portion of the project was also quite exploratory, as it was unclear how difficult it might be to isolate potential COVID-19 cases in a large EMS dataset.
According to the Johns Hopkins Center for Systems Science and Engineering, as of June 9, 2020 (the most current date in our data), there were 258 confirmed cases and 8 deaths in Albemarle County, and 141 confirmed cases and 3 deaths in Charlottesville City.1 While experts expect that actual case counts may be as much as 10 times higher than the confirmed case counts2 it remains unclear whether this figure is representative of the most severe cases, which are those most likely to appear in the EMS dataset. Given the uncertainty surrounding the total number of cases in the area as well as the proportion of cases that may be present in our dataset, it was unclear how effective an analysis of COVID-symptoms would be. Still, we were curious to see whether any trends would emerge, and in doing so hoped to learn about the potential for future use of EMS data in evaluating the state of the pandemic.
Mapping
The map below breaks down the incident rates of our COVID-19 indicator across Charlottesville’s neighborhoods and Albemarle County’s census tracts. In this case, an incident is considered COVID-like when it includes at least one COVID symptom (as described in the Data & Methods page) tab.
Few changes are visible from before and after March 15, 2020, though there appears to be a slightly higher prevalence of COVID-like symptoms downtown and in neighborhoods south of downtown. Interestingly, these neighborhoods also have a higher proportion of Black residents, which is consistent with widely-reported disparities in COVID-19 outcomes between Black and white populations.
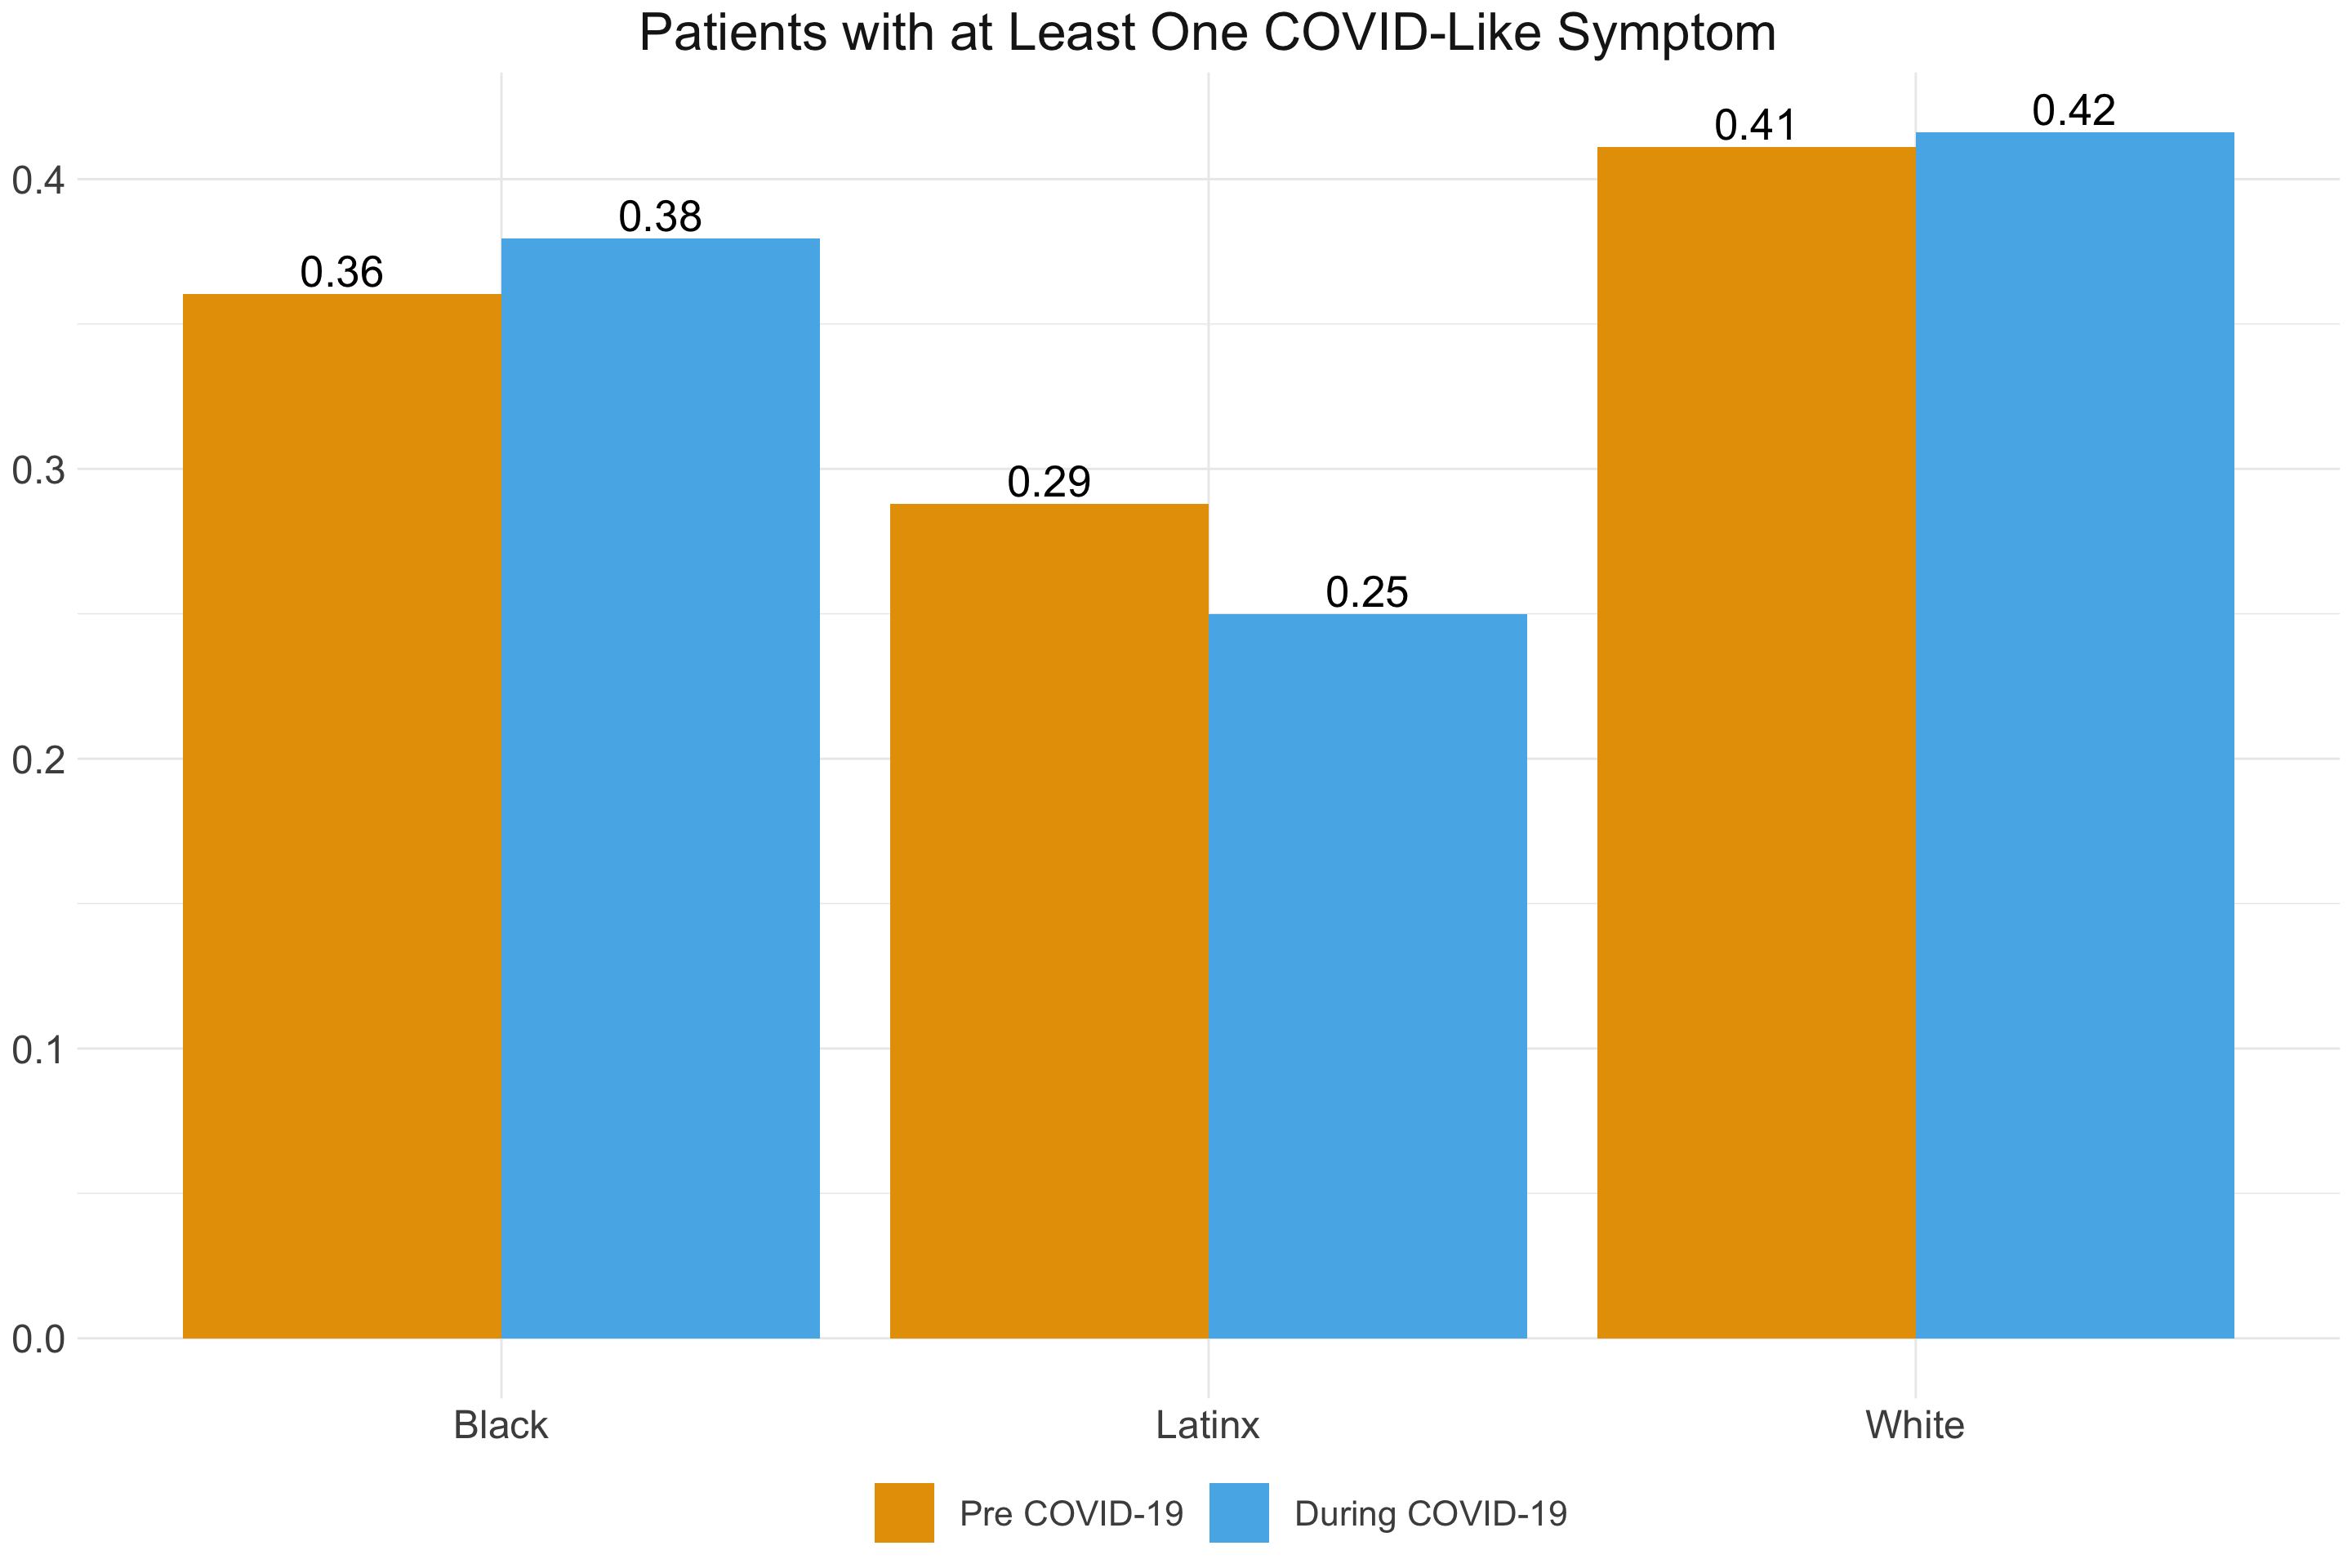
A similar pattern emerges when we break down COVID-like symptoms by racial group. Again, there does not appear to be a noticeable difference in incidence of symptoms before and after the onset of the COVID-19 pandemic. There may be a slightly reduced incidence of symptoms for Latinx individuals, but this difference should be interpreted with caution. As we discuss below, this was one of the first indications that our indicator may not be extracting COVID-19 cases specifically enough for them to emerge over and above the baseline health differences between these populations. Any differences in COVID-19 itself is likely masked by the underlying health characteristics of these populations.
The following table summarizes how frequently each symptom that composes the COVID-19 indicator occurred. Shortness of breath and hypoxemia were more commonly represented in the dataset than many of the other symptoms. The racial groups with the maximum incidence for a particular symptom are highlighted in red (though these should be interpreted in the context of the overall patient count for each racial group). Unsurprisingly, variation exists in the symptoms expressed in different populations. While these numbers likely reflect the general health characteristics of these populations more so than COVID-19 rates themselves, this does raise the question of whether COVID-19 symptoms may be expressed differently across racial groups. Research on this possibility could be important in a more refined approach to identifying COVID-19 cases in EMS data.
| American Indian Or Alaska Native | Asian | Black Or African American | Hispanic Or Latino | Native Hawaiian Or Other Pacific Islander | White | NA | |
|---|---|---|---|---|---|---|---|
| Cough | 0 | 0.02 | 0.02 | 0.01 | 0 | 0.01 | 0.01 |
| Fever | 0.02 | 0.11 | 0.06 | 0.1 | 0.11 | 0.04 | 0.06 |
| Shortness Of Breath | 0.54 | 0.27 | 0.45 | 0.38 | 0.32 | 0.39 | 0.37 |
| Myalgia | 0 | 0 | 0 | 0 | 0 | 0 | 0 |
| Chills | 0.02 | 0 | 0.01 | 0.01 | 0 | 0 | 0 |
| Fatigue | 0 | 0.01 | 0 | 0 | 0 | 0 | 0.01 |
| Headache | 0.09 | 0.12 | 0.09 | 0.13 | 0.14 | 0.06 | 0.06 |
| Diarrhea | 0 | 0.02 | 0.02 | 0.01 | 0.03 | 0.02 | 0.04 |
| Nausea/Vomit | 0.15 | 0.35 | 0.19 | 0.25 | 0.3 | 0.21 | 0.23 |
| Hypoxemia | 0.5 | 0.31 | 0.44 | 0.32 | 0.57 | 0.58 | 0.45 |
| Hypoxemia (No Improvement) | 0.3 | 0.07 | 0.12 | 0.14 | 0.16 | 0.11 | 0.1 |
| Cyanosis | 0 | 0 | 0 | 0 | 0 | 0 | 0 |
| Provider Impression of COVID-19 | 0 | 0.01 | 0 | 0.01 | 0 | 0 | 0 |
| Stroke (Young Person) | 0 | 0.01 | 0.01 | 0.01 | 0 | 0.01 | 0.01 |
| Cardiac Arrest (Young Person) | 0 | 0.01 | 0.03 | 0.03 | 0.05 | 0.02 | 0.04 |
| Breathing Medications | 0.04 | 0.03 | 0.07 | 0.06 | 0.05 | 0.05 | 0.06 |
| Patient Count | 46 | 292 | 4308 | 372 | 37 | 16317 | 541 |
Modeling
While our initial exploration did not seem to indicate much variation in COVID-like symptoms, we still developed simple logistic regression models to confirm or refute these suspicions.
\[\begin{align*} \log(\frac{\pi}{1 - \pi}) = \alpha &+ \boldsymbol{\beta^T_1}(\mbox{gender}) + \boldsymbol{\beta^T_2}({\mbox{race}}) + \boldsymbol{\beta^T_3}(\mbox{age range}) + \boldsymbol{\beta^T_4}(\mbox{COVID era}) \\ &+ (\mbox{COVID era}) \times (\boldsymbol{\beta^T_5}(\mbox{gender}) + \boldsymbol{\beta^T_6}({\mbox{race}}) + \boldsymbol{\beta^T_7}(\mbox{age range})) \end{align*}\]
where \(\pi\) represents the probability of a patient being classified as COVID-like based on our COVID indicator (which incorporates the presence of various symptoms). We initially included an interaction term between COVID era and the rest of our variables to determine whether the changes in COVID symptoms had varied across the levels of these variables. We ran a model of this general form with three different specifications of our outcome variable. In the first specification, we classified patients as COVID-like if they had at least 1 COVID-like symptom. In the second, we used 2 COVID-like symptoms as the cutoff, and in the third we used 3 COVID-like symptoms as the cutoff. Differences in results at varying levels of “strictness” in classifying COVID-like cases would potentially allow us to home in on an appropriate cutoff when classifying COVID cases in this dataset.
Unfortunately, as was likely given our visual exploration of the data, none of these models produced any notable findings. In retrospect, this result seems entirely intuitive. Between the uncertainty surrounding the actual prevalence of COVID cases in our dataset (described above) and our inclusive approach in classifying COVID-like symptoms, we likely have incorporated a lot of noise into our COVID indicator variable. That is, our indicator likely captures many of the COVID cases that do exist in the dataset, but is not specific enough, and so also captures so many non-COVID cases that we are unable to discern subtle trends in COVID symptoms.
Future Directions
While disappointing, this outcome does provide important ramifications for similar research going forward.
First, for EMS data to be a valuable source of information in assessing the course of the COVID-19 pandemic, a more thorough effort to classify COVID symptoms accurately is required. Given the messy nature of EMS data, classifying symptoms effectively is a challenge. However, a more complex approach could certainly be implemented. Improvements on our methodology may be:
- Link EMS data with data on patient outcomes
- Being able to link the symptom data reported by EMS with COVID-19 results could vastly improve our ability to determine which symptoms in the EMS dataset are actually important in determining a COVID-19 diagnosis.
- Implement more complex logic when classifying symptoms
- For instance, a certain symptom may be a strong indicator of COVID, but only in the presence of another symptom as well
- Include a weighting scheme for more important symptoms
- This could reduce noise by highlighting those symptoms that are known to be particularly indicative of COVID
- Develop an indicator using a dataset from an area with a greater proportion of COVID cases
- More cases may make it easier to detect cases in a dataset, and allow for a refinement of the symptoms included. This more specific scheme could then be implemented in other areas with fewer case counts.
- Link multiple EMS datasets
- This could improve the sensitivity of our indicator, but perhaps more importantly would allow for an assessment of the standardization across EMS data platforms. In the future, a large-scale network of EMS data could be a valuable tool in identifying emerging infectious diseases
It will also be valuable to revisit this topic continuously as the medical understanding of COVID-19 evolves. Symptoms that were once thought to be clear identifiers of the virus may become less important, and vice versa. The null results in our preliminary exploration in this area should not be interpreted as a referendum on the value of EMS data in understanding COVID-19, but as a guide to the considerations and improvements that will need to be made to more effectively use EMS data as a tool to fight emerging infectious diseases in the future.
Mandavilli, A. (2020, June 27). Actual Coronavirus Infections Vastly Undercounted, C.D.C. Data Shows. The New York Times. Retrieved from https://www.nytimes.com/2020/06/27/health/coronavirus-antibodies-asymptomatic.html↩︎