Main Findings
Demographics Overview
Summary Statistics of Demographics
| Statistics | Mean | Standard Deviation | Median | Minimum | Maximum |
|---|---|---|---|---|---|
| Total Population | 3957.02 | 2000.39 | 3939.00 | 0 | 8455.00 |
| % Population: African-American | 8.77 | 8.71 | 6.23 | 0 | 35.03 |
| % Population: Asian | 10.12 | 5.82 | 8.48 | 0 | 25.59 |
| % Population: Hispanic or Latino | 14.53 | 9.38 | 12.00 | 0 | 43.13 |
| % Population: White | 72.43 | 14.16 | 74.83 | 26 | 100.00 |
| % Population: Other Race | 12.43 | 6.60 | 10.95 | 0 | 36.32 |
| Median Household Income (HHI): All | 129886.81 | 46690.08 | 121690.00 | 37332 | 250001.00 |
| Median HHI: African-American | 83521.25 | 42883.77 | 76043.50 | 24070 | 226000.00 |
| Median HHI: Asian | 124664.00 | 59416.36 | 110152.50 | 12955 | 250001.00 |
| Median HHI: Hispanic or Latino | 112690.00 | 55616.09 | 104766.00 | 2499 | 250001.00 |
| Median HHI: White | 138548.68 | 44176.81 | 126484.00 | 61181 | 250001.00 |
| Median HHI: Other Race | 133182.57 | 48303.60 | 130813.50 | 73507 | 250001.00 |
| % in Poverty: All | 6.49 | 4.57 | 5.76 | 0 | 18.63 |
| % in Poverty: African-American | 11.95 | 18.01 | 5.41 | 0 | 100.00 |
| % in Poverty: Asian | 10.84 | 13.53 | 3.97 | 0 | 55.07 |
| % in Poverty: Hispanic or Latino | 8.71 | 9.52 | 5.94 | 0 | 40.18 |
| % in Poverty: White | 4.78 | 3.23 | 4.24 | 0 | 14.69 |
| % in Poverty: Other Race | 6.19 | 9.98 | 0.00 | 0 | 36.77 |
| % Population under 18 | 16.97 | 8.47 | 17.75 | 0 | 31.88 |
| % with an Ambulatory Disability | 0.82 | 0.68 | 0.69 | 0 | 2.43 |
| % Population with No Vehicle | 11.32 | 9.68 | 8.71 | 0 | 35.72 |
| Mean number of properties<br>with greenspace | 0.50 | 0.38 | 0.55 | 0 | 1.00 |
| % Pop. with no Health Insurance | 5.47 | 4.38 | 4.76 | 0 | 16.86 |
| % of housing with rent > $30K | 35.23 | 15.31 | 35.10 | 0 | 74.40 |
Demographic Breakdown by Race
Park Access
Circle Radius Methods
When we use 1/2 mile radius circles as proxies for access 99.65 percent of residences are covered with park access. This is incredibly high. However, this doesn't take into account park quality, amenities, or acreage.
| Distance | Coverage |
|---|---|
| 1/2 Mile Circle | 99.65424 |
Traveltime Isochrone Method
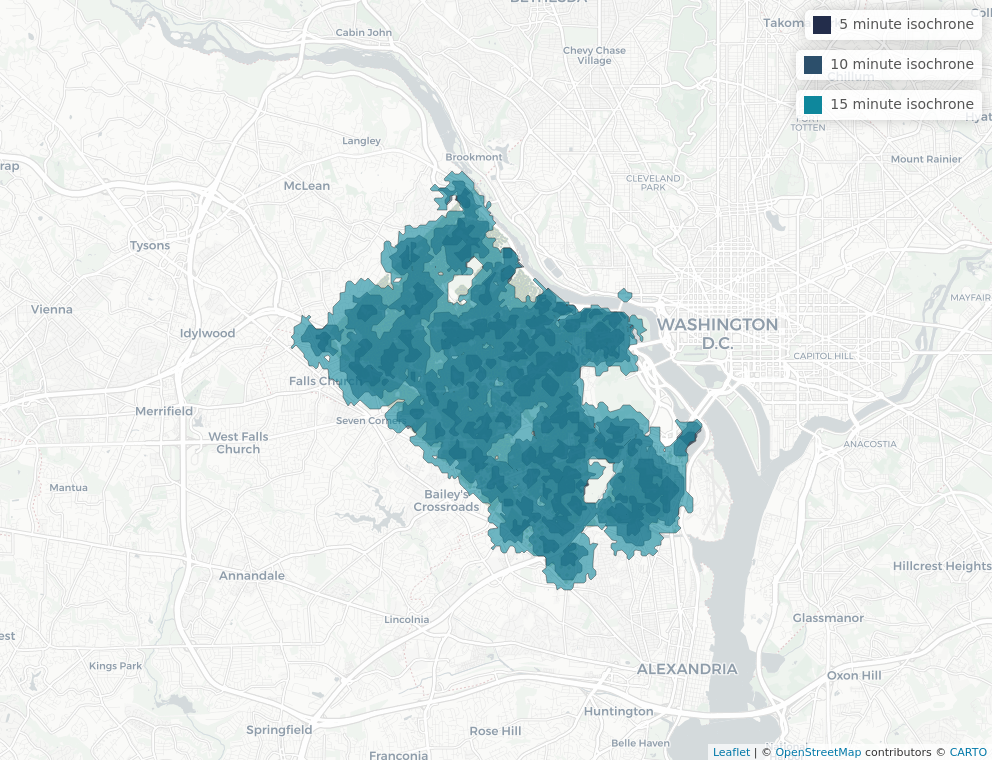
To get an idea of park access, we computed coverage as the percentage of total residences that are covered within time-based isochrones from the centroid of each park. We did this for walking, driving, and public transportation. Here we feature the walking map.
Walking
When we create access polygons as 5-, 10-, and 15-minute polygons of walking, 32 percent, 85, ad 99 percent of residences are covered respectively. Within a short walk this isn't very high coverage, but within 10 minutes this is high coverage.
| Time | Coverage |
|---|---|
| 5 Minutes | 32.81442 |
| 10 Minutes | 85.48678 |
| 15 Minutes | 98.99169 |
Amenity Access
To measure park access we also care about measuring access to good parks. To measure park goodness we use amenities as a proxy variable. The following maps and tables measure individual's access to different types of amenities. We did this for tennis courts, basketball courts, playgrounds, and parking. We will highlight playgrounds below.
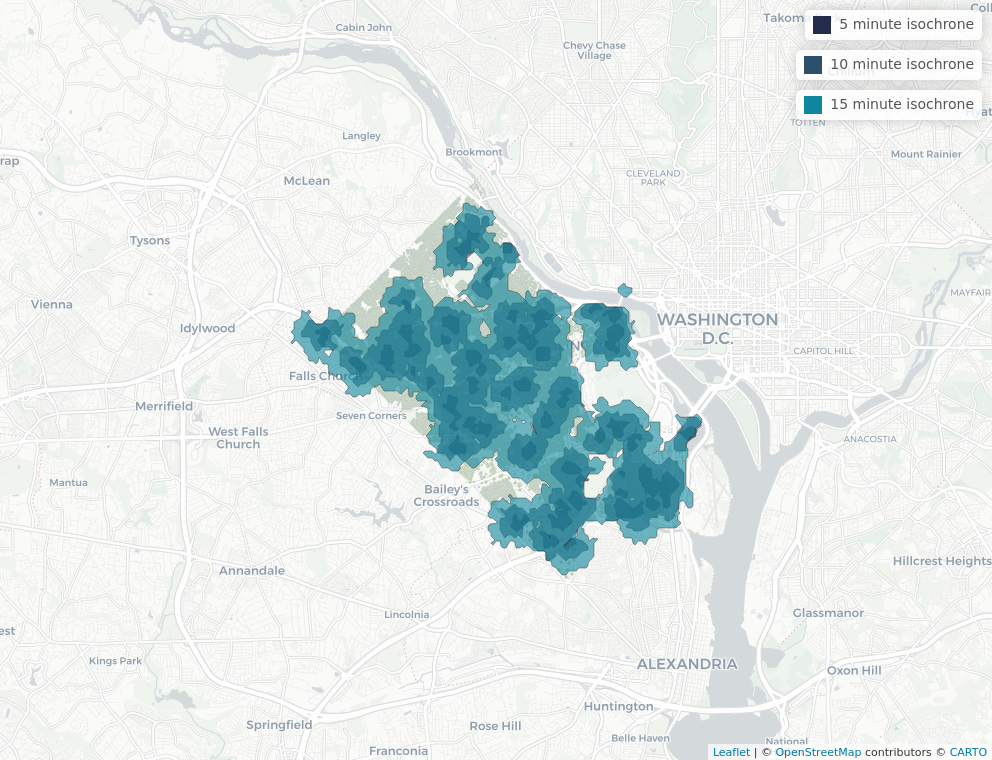
Playgrounds
So similarly to what we saw above, we now evaluate access in terms of the percent of total residences in the county that have access to the playground amenity within a 5-, 10-, or 15-minute isochrone via walking, public transportation, or driving.
Walking
| Time | Coverage |
|---|---|
| 5 Minutes | 13.02459 |
| 10 Minutes | 53.55975 |
| 15 Minutes | 85.74056 |
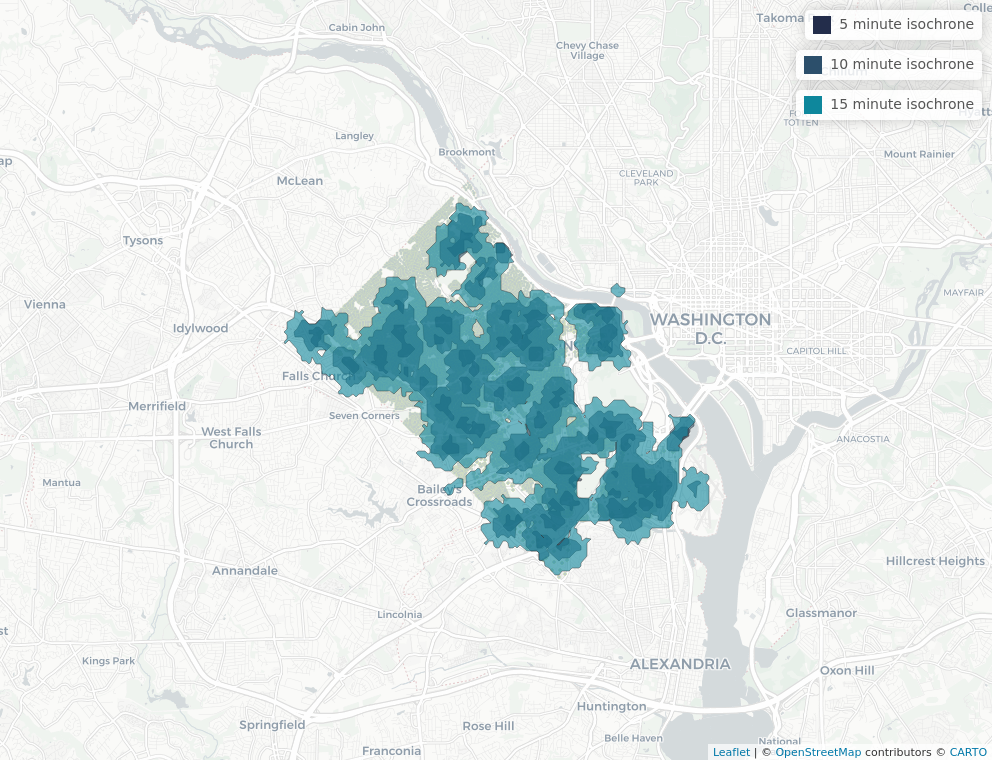
Public Transportation
| Time | Coverage |
|---|---|
| 5 Minutes | 13.01097 |
| 10 Minutes | 54.11841 |
| 15 Minutes | 87.80828 |
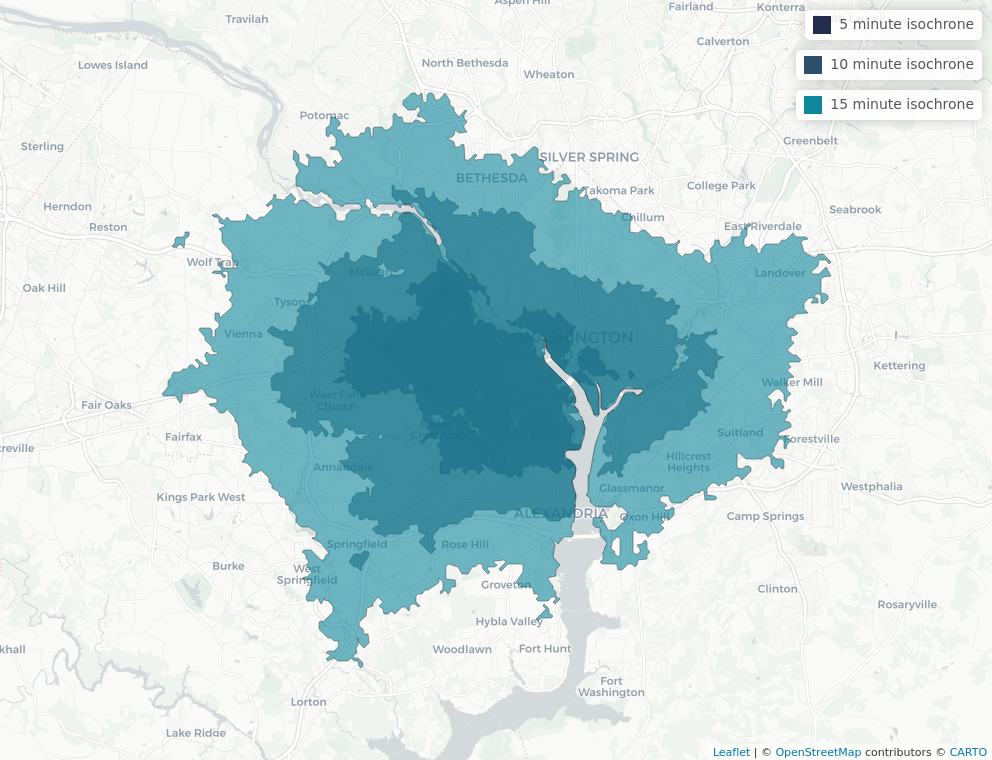
Driving
| Time | Coverage |
|---|---|
| 5 Minutes | 0.5739883 |
| 10 Minutes | 81.2338193 |
| 15 Minutes | 100.0000000 |
Two-Step Floating Catchment Area Scores
In addition, we investigated how park accessibility varies across Census tracts within racial groups. We used the two-step floating catchment area method to calculate spatial accessibility scores for Census tracts in Arlington County by race. These scores give a measure of accessibility for each tract to the parks and their amenities in Arlington County and are calculated as the summation of the supply to demand ratio for each park contained in the catchment area of the Census tract. The supply of a park is defined by its acreage and its demand is defined by the total population count of a racial group in a Census tract. The catchment areas for both the parks as well as Census tracts are defined by a distance of one mile. Census tracts with higher scores are considered to have more accesibility to parks and their amenities.
All Park Acreage
Here, we consider every park in Arlington County when calculating the accessibility of the Census tracts. We can see that the West to Southwest area of Arlington County has the highest level of accessibility. We observed that for the Black, Asian, and Other populations, however, there are high levels of accessibility in the Northern region. This is due to the fact that those areas have a number of large acreage parks combined with the low numbers of people who identify as Black, Asian, or Other.