Sequence Exploration
Visualizing and exploring post-military veteran career sequences
Exploring veteran’s whole career sequences
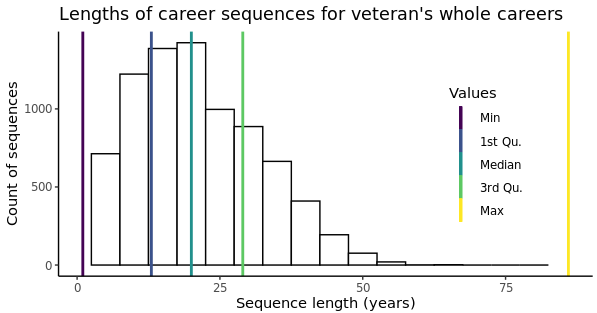
After cleaning the BGT data, we created our sequence objects using TraMineR. To begin, we created a sequence object using the whole career of veterans. This yielded 8,068 sequences of varying lengths. When creating the whole career sequence object, we defined eight unique states: Zone 1, Zone 2, Zone 3, Zone 4, Zone 5, Missing zone, Military, Military transition unemployment, Civilian unemployment, and Retired. For the preliminary analysis, all unemployment states (Military transition, Civilian, and Retired) are collapsed into one Unemployment state.
Among the sequences in the whole careers sequence object, there was a large distribution in sequence length. Differing lengths in sequences makes comparative analysis, including computing distance and clustering, difficult. In our case, clustering based on the preliminary sequence yielded “cohort” clusters, or clusters grouped essentially by sequence length. For our purposes, this does not yield a typology of careers so much as a descriptive grouping of veterans.
Next, we visualized the whole career sequences by looking at the mean time spent in each state. For help interpreting sequence graphs, please visit the interpreting sequence graphs section in our Methods.
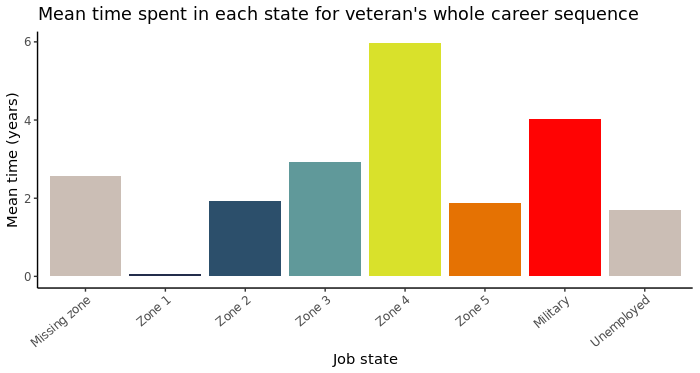
As shown in Figure 2, veterans on average spend the highest amount of time in Zone 4, for about six years. Military careers are the second highest, averaging out to about four years. Interestingly, veterans spend almost the same amount of time unemployed as Zone 4, for about two years. Time spent in Zone 1 is considerably lower than all other states at an average of almost zero.
Overall, the results of the sequence length and mean time analysis track with our knowledge of BGT resume data. These results show that the data overrepresent young (short sequences), white collar (higher zone) veterans. Looking at the state distribution plot gives us our first insights into the career paths of veterans over time.

Figure 3 shows that there is some degree of career mobility for veterans overall over time. About 45% of the sample begins their career in a military state, with that number dropping steadily over time. Unemployment peaks for veterans around five years and around sixty years, when the sample is much smaller. Looking at the Zone states, Zone 2 and 3 show a similar pattern of peaking at in early career stages and steadily declining. Both Zones 3 and 4 see the opposite effect by steadily widening to greater frequency over time. These preliminary findings suggest veterans do experience some degree of career mobility over time, moving out of unemployment and moving to higher zones.
Exploring first ten years after veteran’s military exit sequences
To begin answering our research questions about veterans careers, we needed to subset our sample to analyze careers only after veterans exit the military. Additionally, after preliminary analysis and clustering, we decided to subset again to only the first ten years of a veteran’s post military career to combat problems associated with differing sequence lengths. Setting these new parameters yielded a sequence object with 5,185 sequences.
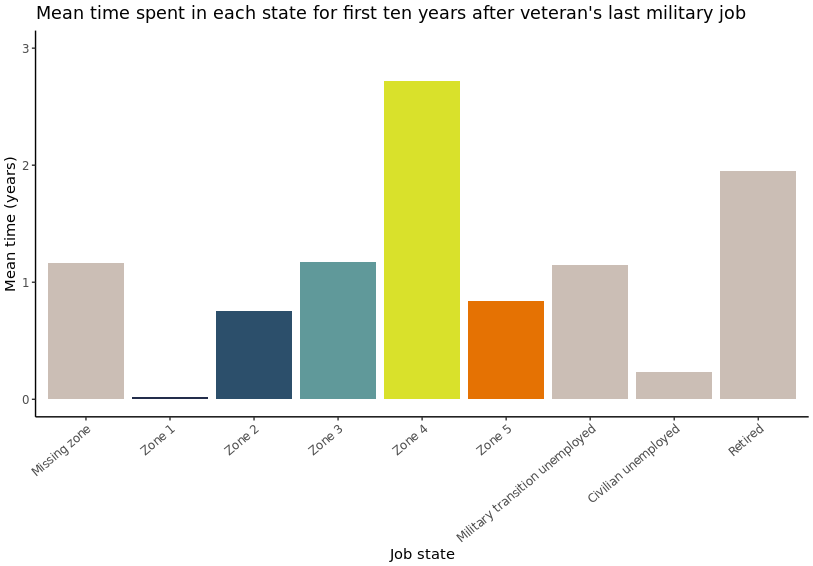
As shown in Figure 4, similar to the whole career sequence, Zone 4 is on average where veterans spend the most amount of time, almost three years. For the other Zones, their proportion to Zone 4 stays relatively similar to the inital exploration. The biggest difference in the new subset is the proportion of unemployment states to Zones. Military transition unemployment is equal to or higher than all Zones except for Zone 4 at a little over a year. Moreover, retirement is the second highest state on average, for about two years. This suggests that veterans frequently experience a state of unemployment after exiting the military.
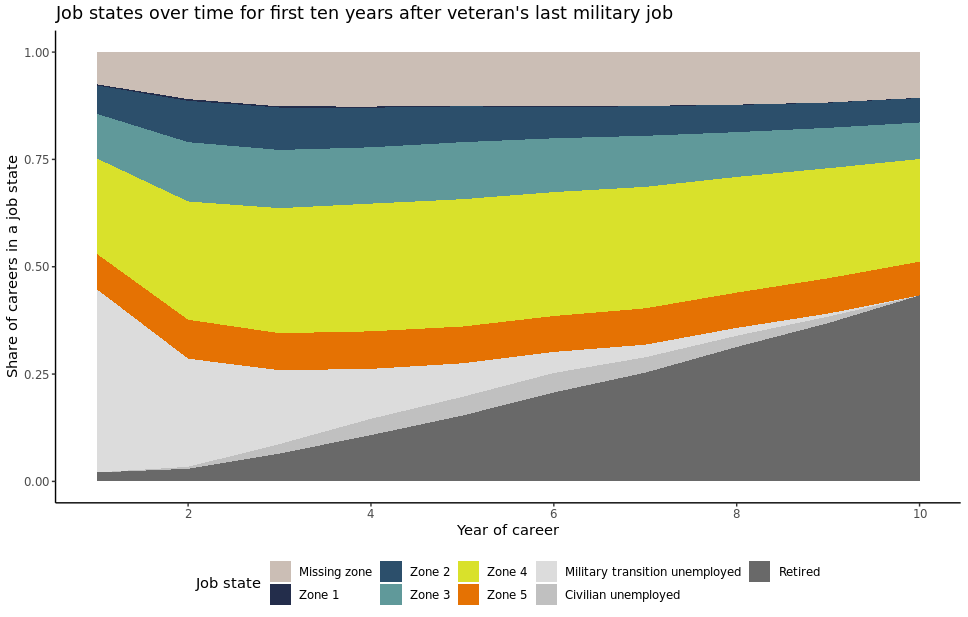
The state distribution analysis, as shown in Figure 5, further describes the picture of employment outcomes for veterans. Interestingly, up to two years after exiting the military, the most frequent state for veterans is miliatry transition unemployment. While this military transition unemployment declines over time, there is not great preliminary evidence for great career mobility in the first ten years of employment. Zones 4 and 5 do not widen over time, instead they stay relatively stagnant. The number of veterans in retirement increases steadily over the ten year period.
Conclusions and Implications
The intital exploration of sequences helped us to define and prioritize our research questions and project scope. By subsetting to the first ten years of a veteran’s post military career, we were able to make more meaningful comparisons between sequences, which is necessary for cluster analysis. Preliminary findings suggest that veterans do not experience great career mobility in the first ten years of their career. In subsequent findings sections, we will build on this analysis using clustering and tournament models. With clustering, we will explore creating a typology of careers and the explanatory factors associated with cluster assignment. Through tournament modeling, we will explore the idea of career mobility using the theory of path dependence.