Evaluation
Performance Metrics
How do we evaluate our work?
There are several high-level and granular metrics to investigate to best understand how the model performs on new data when evaluating model performance. We split our balanced dataset into training and testing sets to evaluate the performance of our models using various parameters such as accuracy, precision, recall, and F-1 scores for classification. We also make use of confusion matrices and Receiver-Operating Characteristics (ROC) Curves. Furthermore, we use our unbalanced dataset to cross-validate our models for more insight into our model performance when an unbalanced dataset is presented to it.
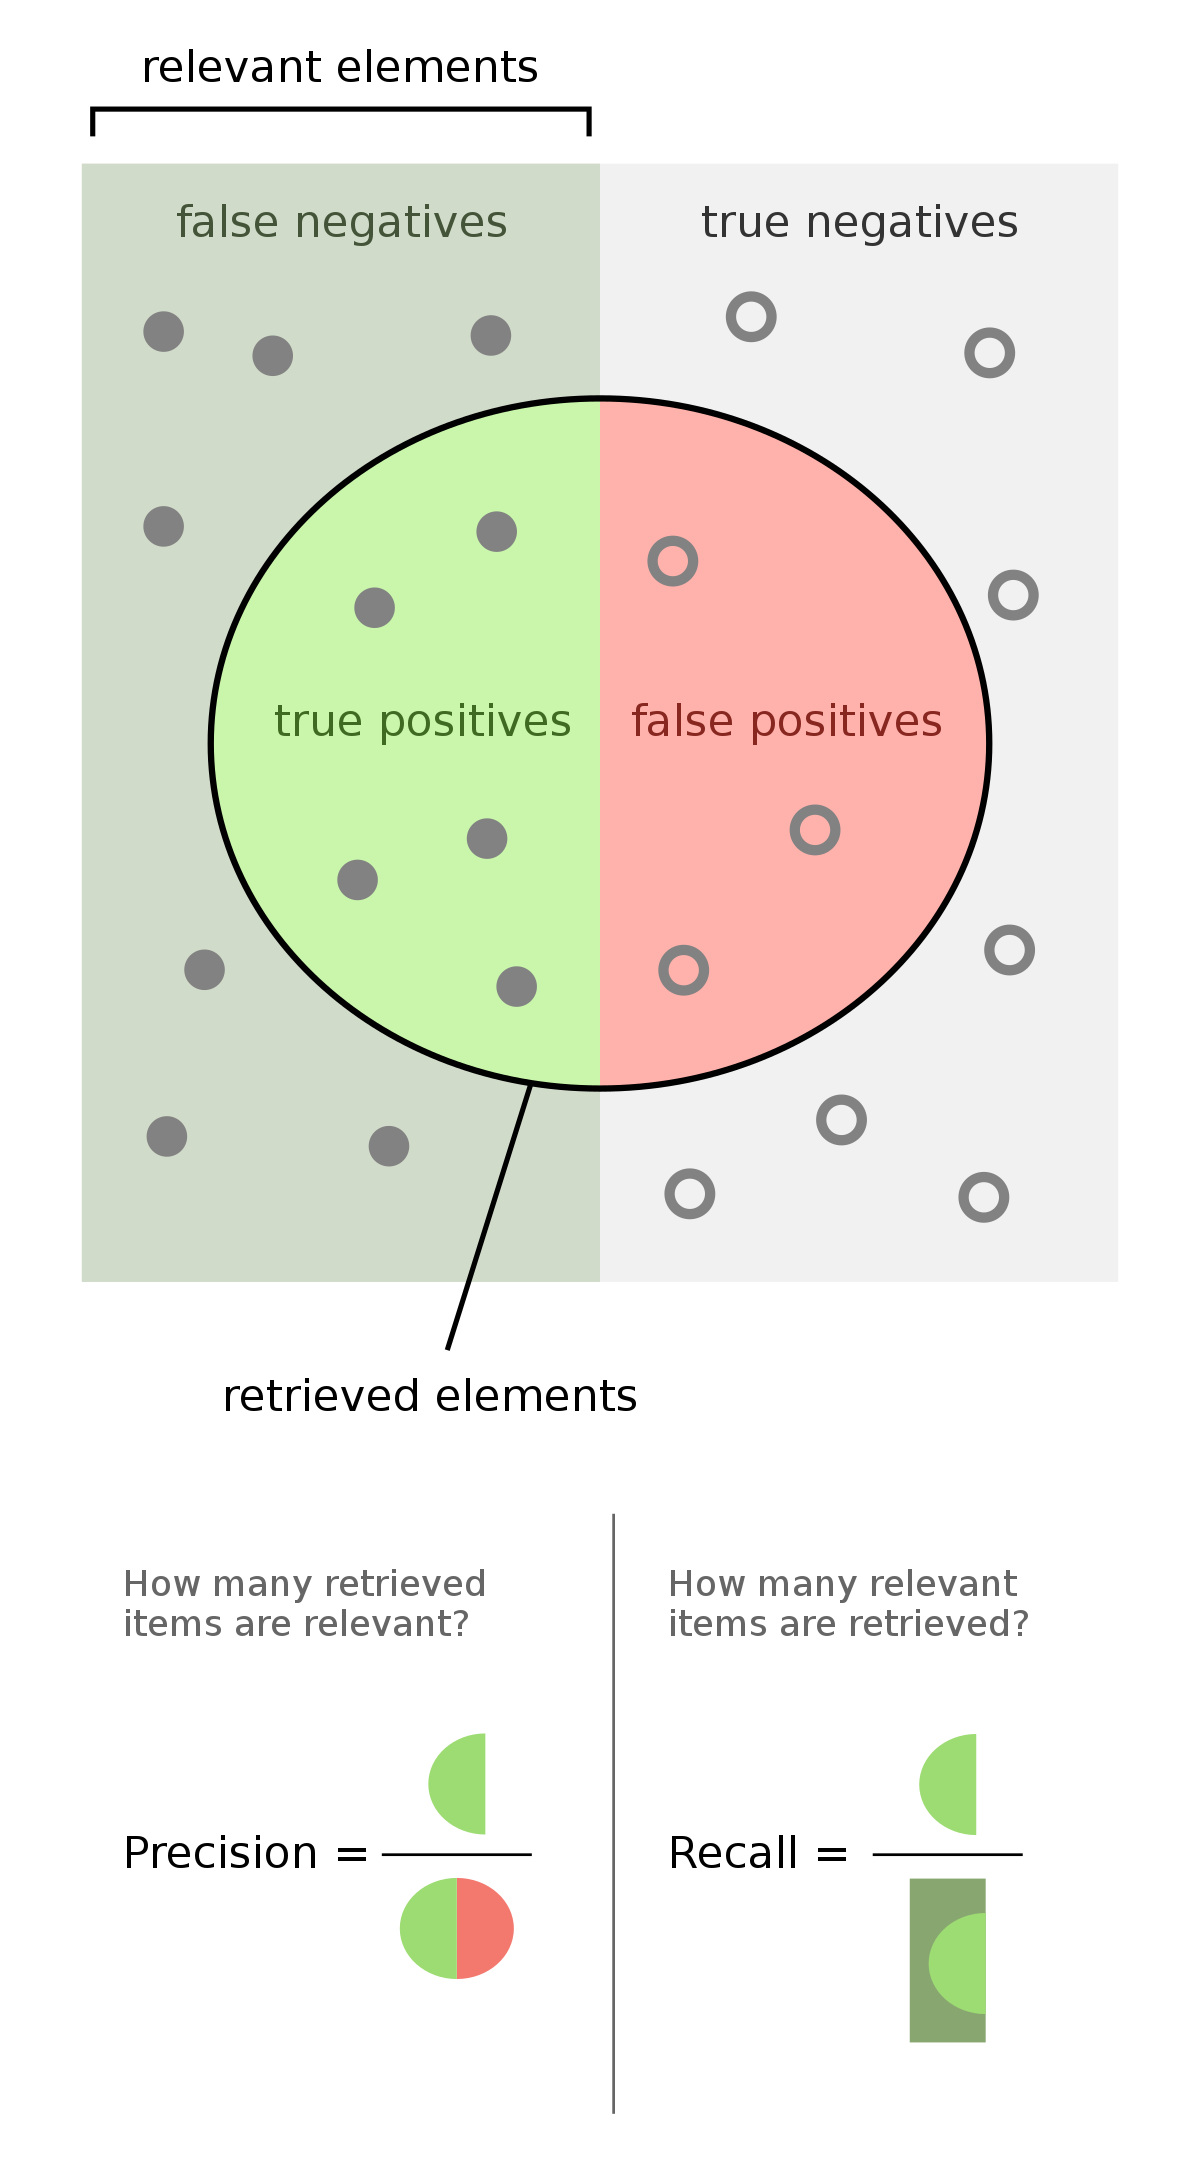
When using these tools, we consider the specific successes and errors our models make. Successes include:
- True Negatives (TN): articles without mention of innovation that the algorithm correctly predicted as a "No"
- True Positives (TP): articles mentioning new, available products that the algorithm correctly predicted as a "Yes"
Errors include:
- False Positives (FP): articles without mention of innovation that the algorithm incorrectly predicted as a "Yes" (also known as Type I error)
- False Negatives (FN): articles mentioning new, available products that the algorithm incorrectly predicted as a "No" (also known as Type II error)
Using these categories, we can then calculate and examine the following metrics:
Accuracy
Accuracy is defined as the fraction of predictions that our model got right from all its predictions for all the classes. Here, this would be:
\[ \frac{TP + TN}{TP + TN + FP + FN} \]
Precision
Precision is defined as the fraction of predictions that our model got right from the total predictions it made for that class.
\[ \frac{TP}{TP + FP} \]
Recall
Recall is defined as the fraction of predictions that were predicted correctly among the labels that belong to that class.
\[ \frac{TP}{TP + FN} \]
F-1 Score
The F1 score is another measure of a model’s accuracy, calculated as the harmonic mean of the model's precision and recall. The highest possible value of an F-score is 1.0, indicating perfect precision and recall, and the lowest possible value is 0.
\[ 2 * \frac{Precision * Recall}{Precision + Recall} \]
Receiver-Operating Characteristics (ROC) Curves & Confusion Matrices
To better illustrate model performance, we make use of ROC curves and confusion matrices. ROC curve plots the performance of a model in terms of the error rate over increasing probability thresholds. The area under the curve (AUC) associated with an ROC curve is used as a measure of accuracy for a model. The straight diagonal line indicates a 50/50 guess and is used here as a baseline for performance.
A confusion matrix provides insight with regards to exactly how each model classified articles correctly and incorrectly, by displaying predictions by their type: TN, TP, FP, and FN.