Results
Classification
Top-3 Performing Transformer Models
Our best performing model is the DistilBERT model paired with a Support Vector Machines classifier using an RBF kernel. This model demonstrates the highest performance metrics with a balanced dataset. When cross-validation is used to further test performance with an unbalanced dataset, we find this model also has the best cross-validation score.
| Model | Accuracy | Precision | Recall | F1 | Cross-Validation Score |
|---|---|---|---|---|---|
| distilbert-base-uncased_SVM_rbf-kernel | 90.09 | 83.82 | 100 | 91.2 | 85.97 |
| distilbert-base-uncased_logistic regression | 87.39 | 83.08 | 94.74 | 88.52 | 82.47 |
| google/bigbird-roberta-base_logistic regression | 85.59 | 82.54 | 91.23 | 86.67 | 81.63 |
We make use of a balanced dataset of 222 observations in each of our "yes" and "no" target classes for calculating the accuracy, precision, recall, and F-1 score. We split this dataset having 444 total observation into a training set containing 333 observations and a testing set containing 111 observations, respectively (train-test-split = 75% train - 25% test). For cross-validating our models, we made use of the entire unbalanced dataset of 600 observations. We effectively had 222 observations for the "yes" class 378 observations for the "no" class.
Our ROC curves and confusion matrices reinforce the findings of our performance metrics above.
ROC Curve
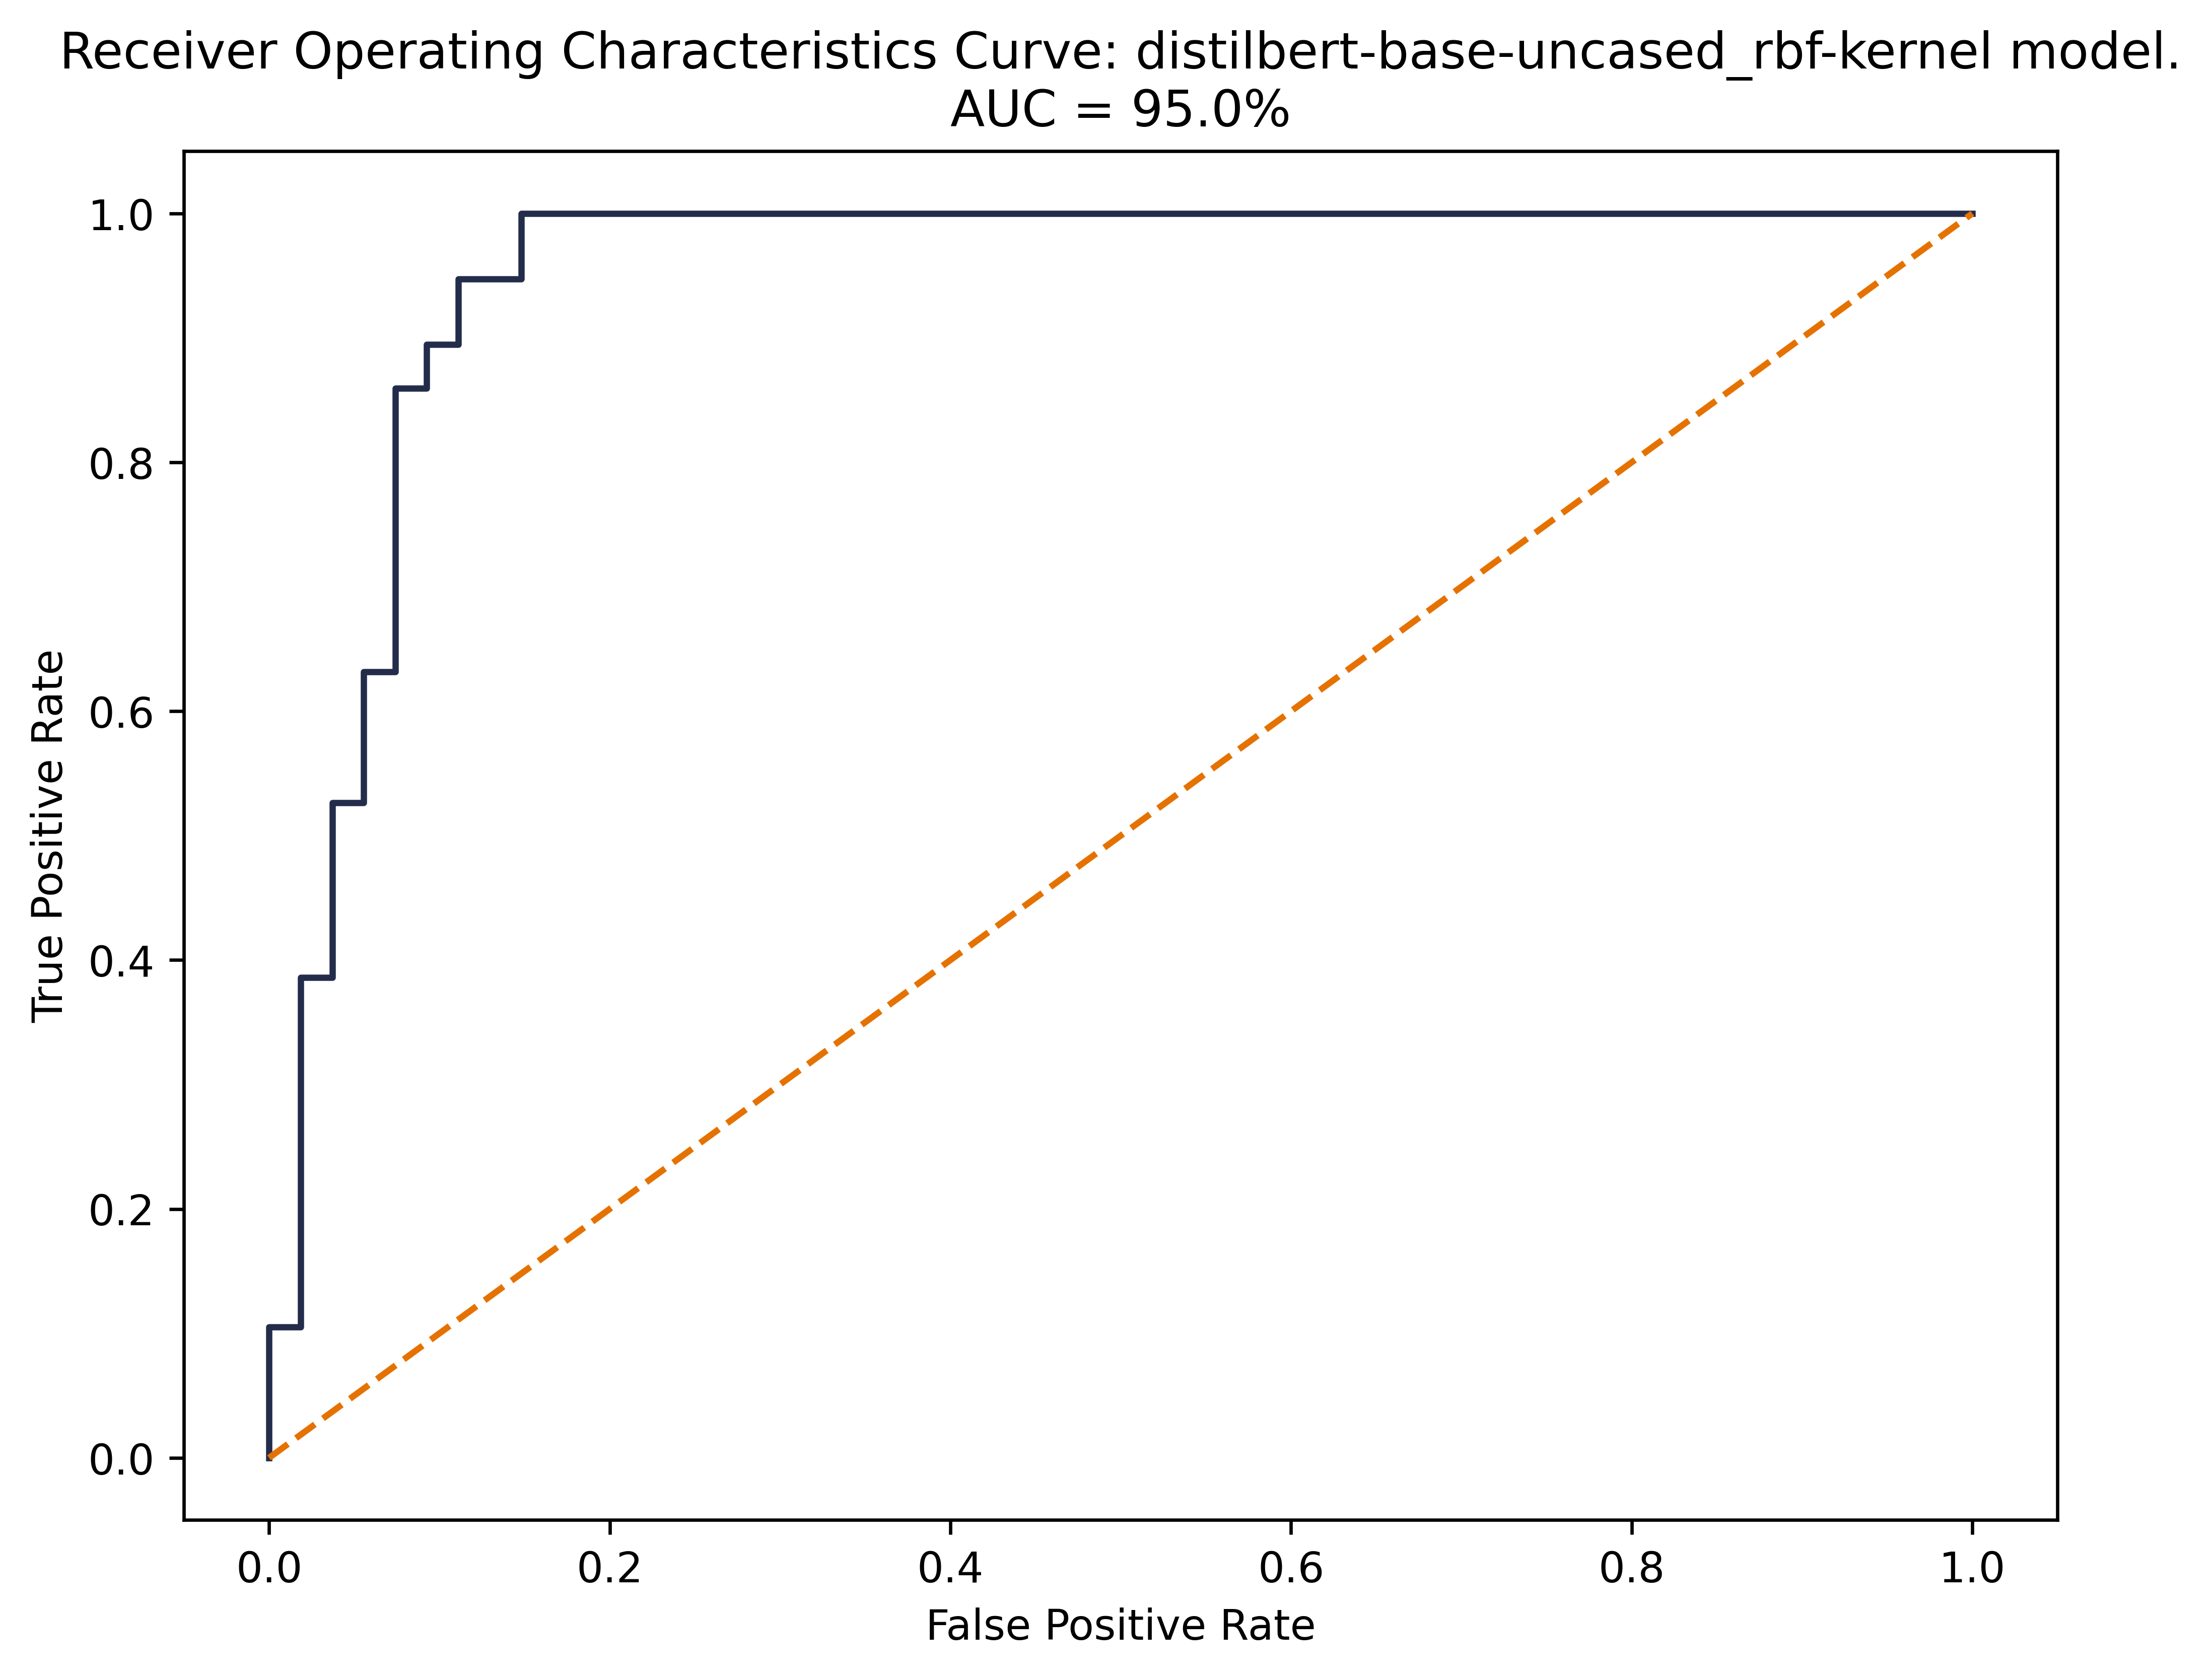
Our DistilBERT model, paired with the Support Vector Machine classifier, shows the strongest performance in terms of Area Under the Curve (AUC). The DistilBERT-SVM model exhibits the best AUC at 95%, as compared with 90% and 88% with the DistilBERT-Logistic Regression and Big Bird-Roberta models respectively (see Appendix for additional ROC curves and confusion matrices).
Furthermore, we observe that the slope of the curve itself is strongest for the DistilBERT-SVM model where the curve shows the steepest, immediate rise over long run, indicating the model's develops the ability to distinguish between innovation text and non-innovation text much more quickly.
Confusion Matrix
There are some interesting results in our three models' confusion matrices. Firstly, we observe that each model's TN and FP counts are identical. For the TP and FN counts, we observe the following ranking:
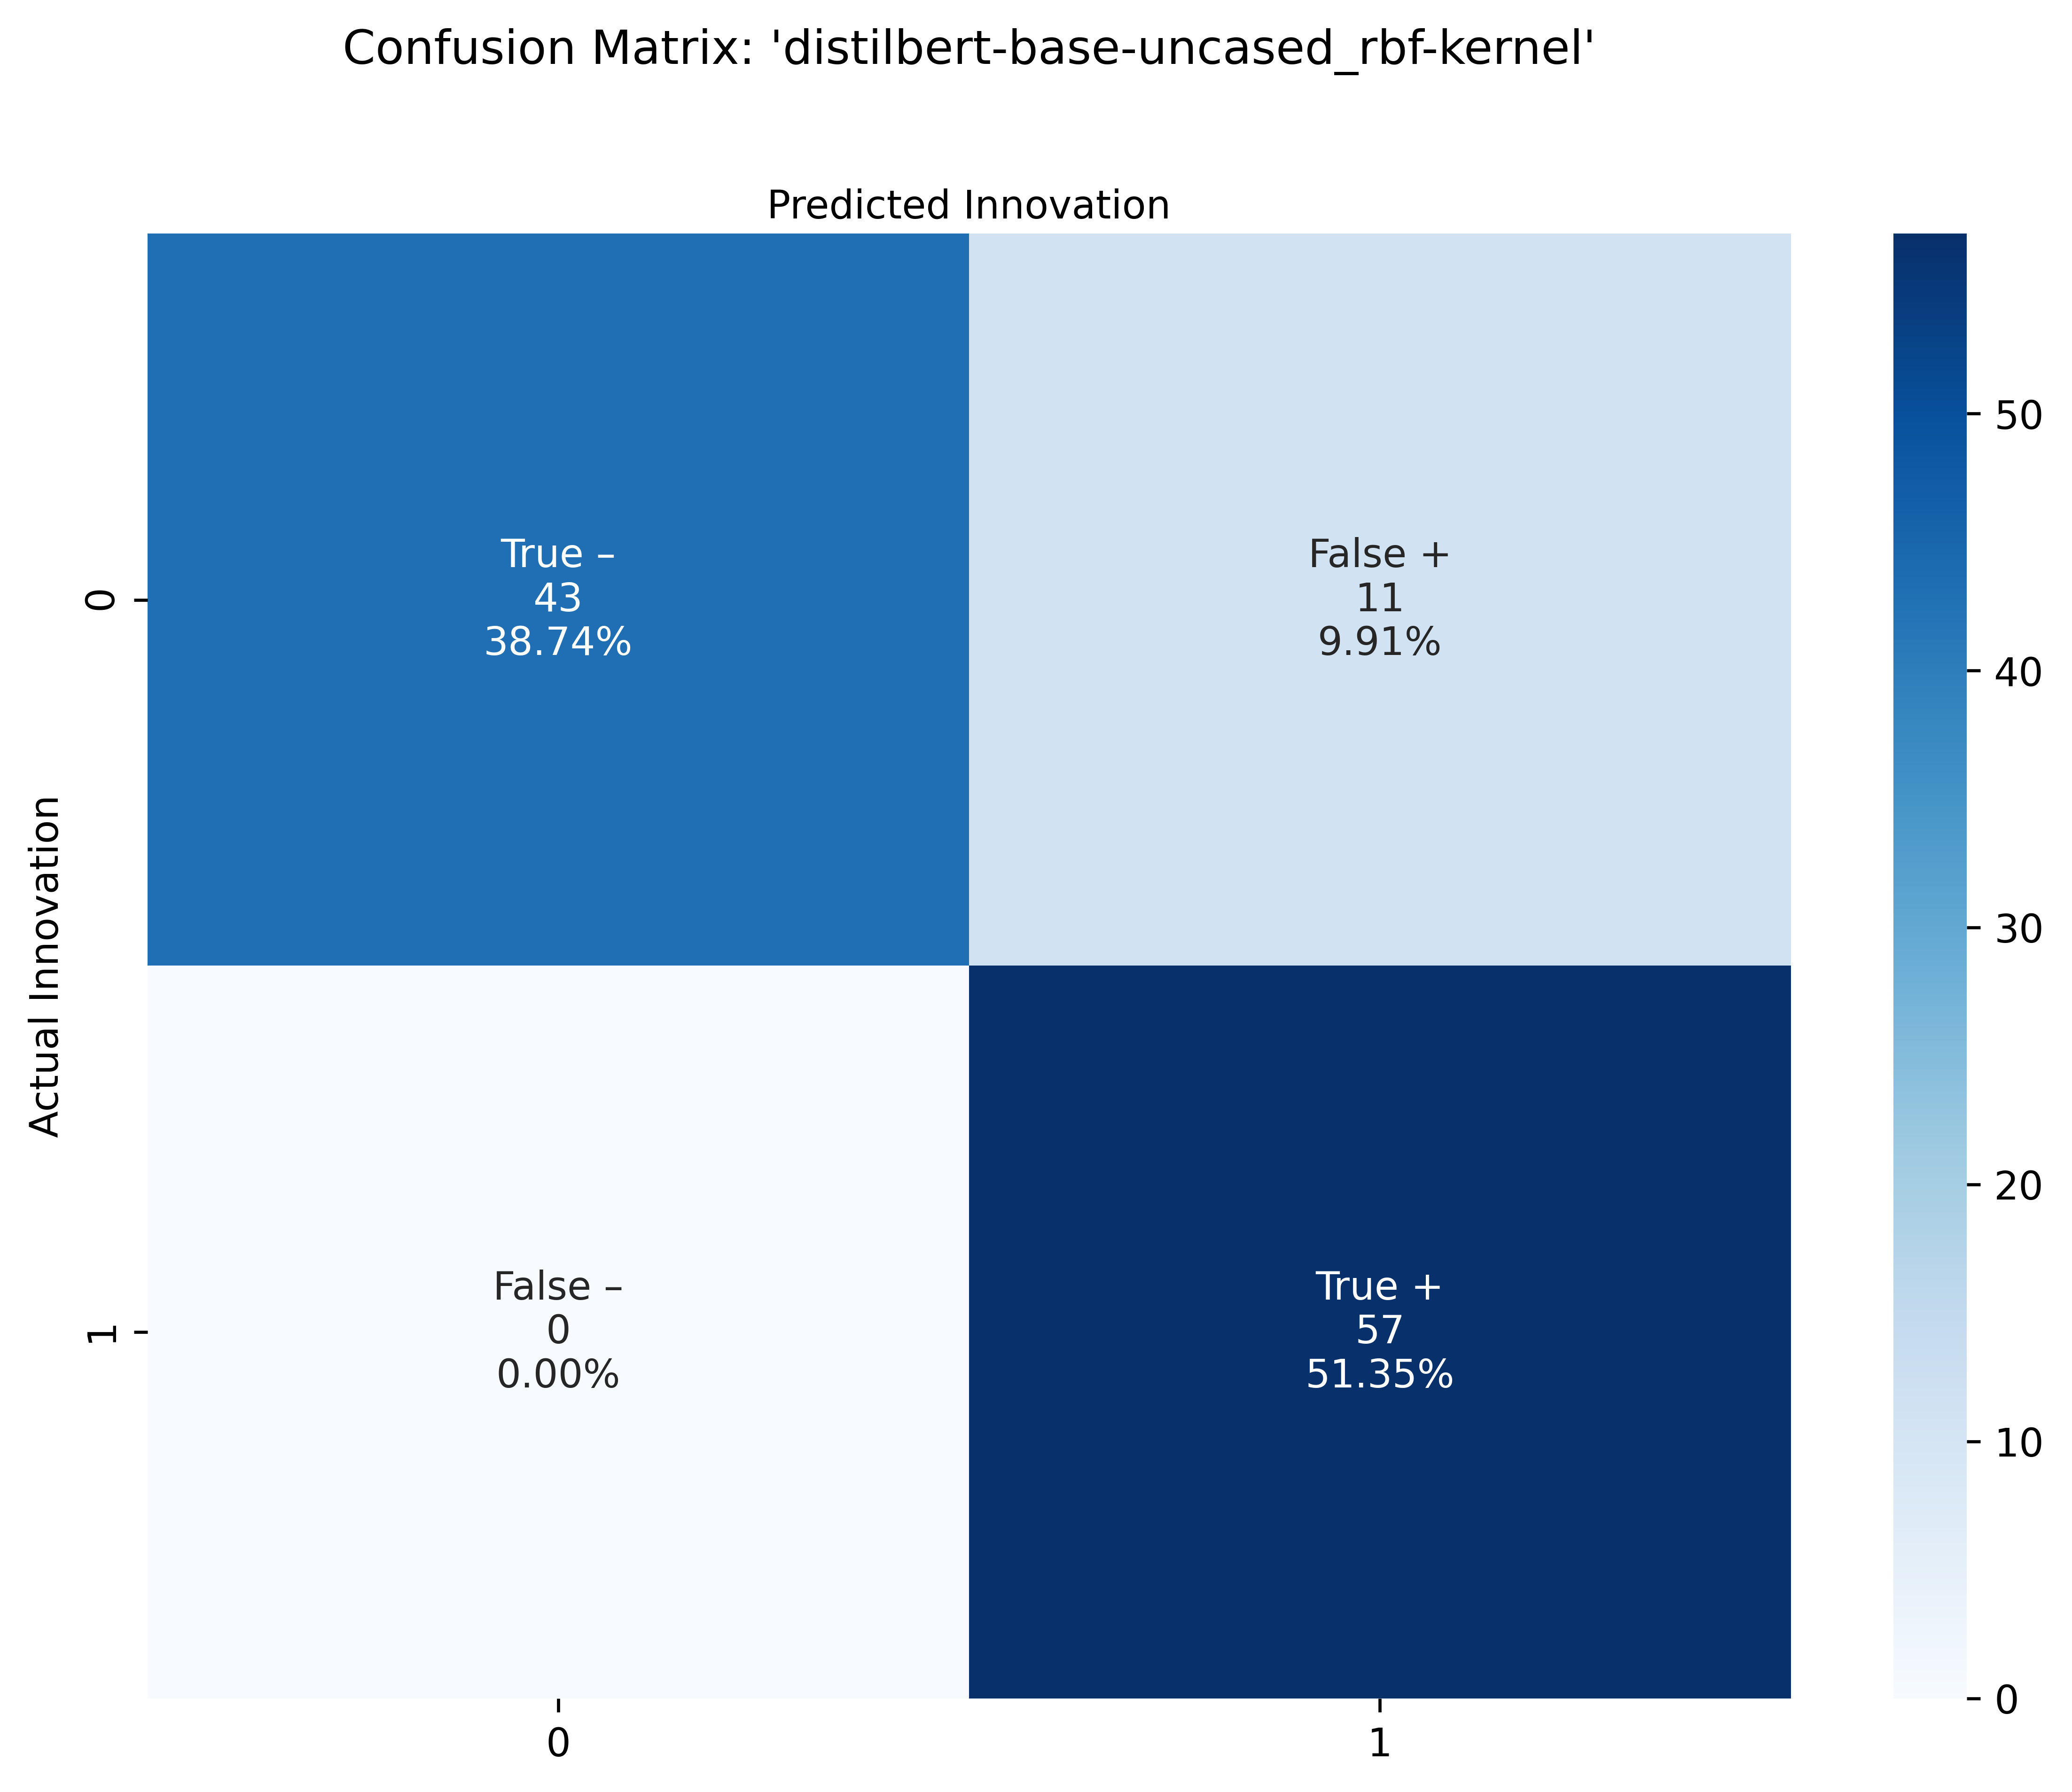
- DistilBERT-SVM shows best TP-FN tradeoff with 0 FNs,
- DistilBERT-LR shows next best tradeoff with 3 FNs,
- Big Bird RoBERTA-LR shows worst performance in terms of TP-FN trade off with 5 FNs.
Looking at the distilbert SVM confusion matrix, we see improvement from the first distilbert logistic regression confusion matrix, as 3 FN’s move into TP’s. Lastly, the Big Bird Roberta Logistic Regression confusion matrix seems to perform worse, compared to the first distilbert logistic regression confusion matrix, as it shows an extra 2 FN’s that seem to move from the TP’s.
Named Entity Recognition
Using the "exact match only" method and the BERT base model for NER described in our Methods section, we were better able to assess our results. Based on this matching, we saw an accuracy of 50.90%, meaning the companies identified by NER correctly matched the company names we manually labeled in 113 of 222 innovative articles.
More work is needed to improve company name matching, as we observed that cases without an 'exact match' often showed a partial match, like in the case of "American LegalNet, Inc." and "American LegalNet, Inc" shown in the 3rd row of the table below, where the only difference hindering the match was a punctuation mark. In other cases, the lack of a match was more complicated, such as in the case of "Hewlett-Packard (HPQ)" and "HP Labs" where the two names do not really match, but refer to the same corporate entity. Here are 4 articles and the NER predictions and accuracy associated with them:
| Sample Text | Labeled Company 1 | Labeled Company 2 | Top Rated NER Company Guess | NER Confidence score | Accuracy |
|---|---|---|---|---|---|
| Metrologic Group and Creaform have entered into a partnership in which Creaform integrates Metrologic Group's software suite with its new CUBE-R‚Ñ¢ 3D automated dimensional inspection solution. This laser scanning, all-in-one solution features Metrologic Group's advanced 3D measurement programming and inspection software packages, Silma and Metrolog X4 i-Robot, and combines efficiency and reliability of robotization in an automated industrial measuring cell. | Creaform | Metrologic Group | Metrologic Group | 0.9986972 | correct |
| BoardwalkTech; Boardwalktech Announces BW.Supplychain Ecosystem for Retail, Apparel, and CPG 2020 JAN 27 (VerticalNews) BW.Supplychain provides a more efficient platform for inventory management and leverages the Boardwalk patented cell level transaction chaining technology for early detection of supply chain disruptions - amplifying beneficial ones, while mitigating or resolving disruptive ones -- using our rapid collaboration, planning and operations applications with results delivered via the BW.ControlTower. | BoardwalkTech | NA | BoardwalkTech | 0.8686774 | correct |
| American LegalNet, Inc. American LegalNet Announces New eDockets Reporting Features and eDockets/NetDocuments Integration | American LegalNet, Inc. | American LegalNet (ALN) | American LegalNet, Inc | 0.8686774 | no exact match |
| Sprinting from a conference call earlier today to announce new server products, Hewlett-Packard ( HPQ) head of enterprise technology David Donatelli was kind enough to swing by Barron's offices.Donatelli, who has been at HP for four years now, has helped the enterprise group productize three different inventions of HP Labs, including Project Moonshot, the subject of today's server announcement; something called StoreOnce, for " data de-duplication"; and StoreAll, to help compliance and legal departments perform data analysis on the vast troves of archived material companies amass. | HP | Hewlett-Packard ( HPQ) | HP Labs | 0.9985487 | no exact match |
Applying our Algorithm!
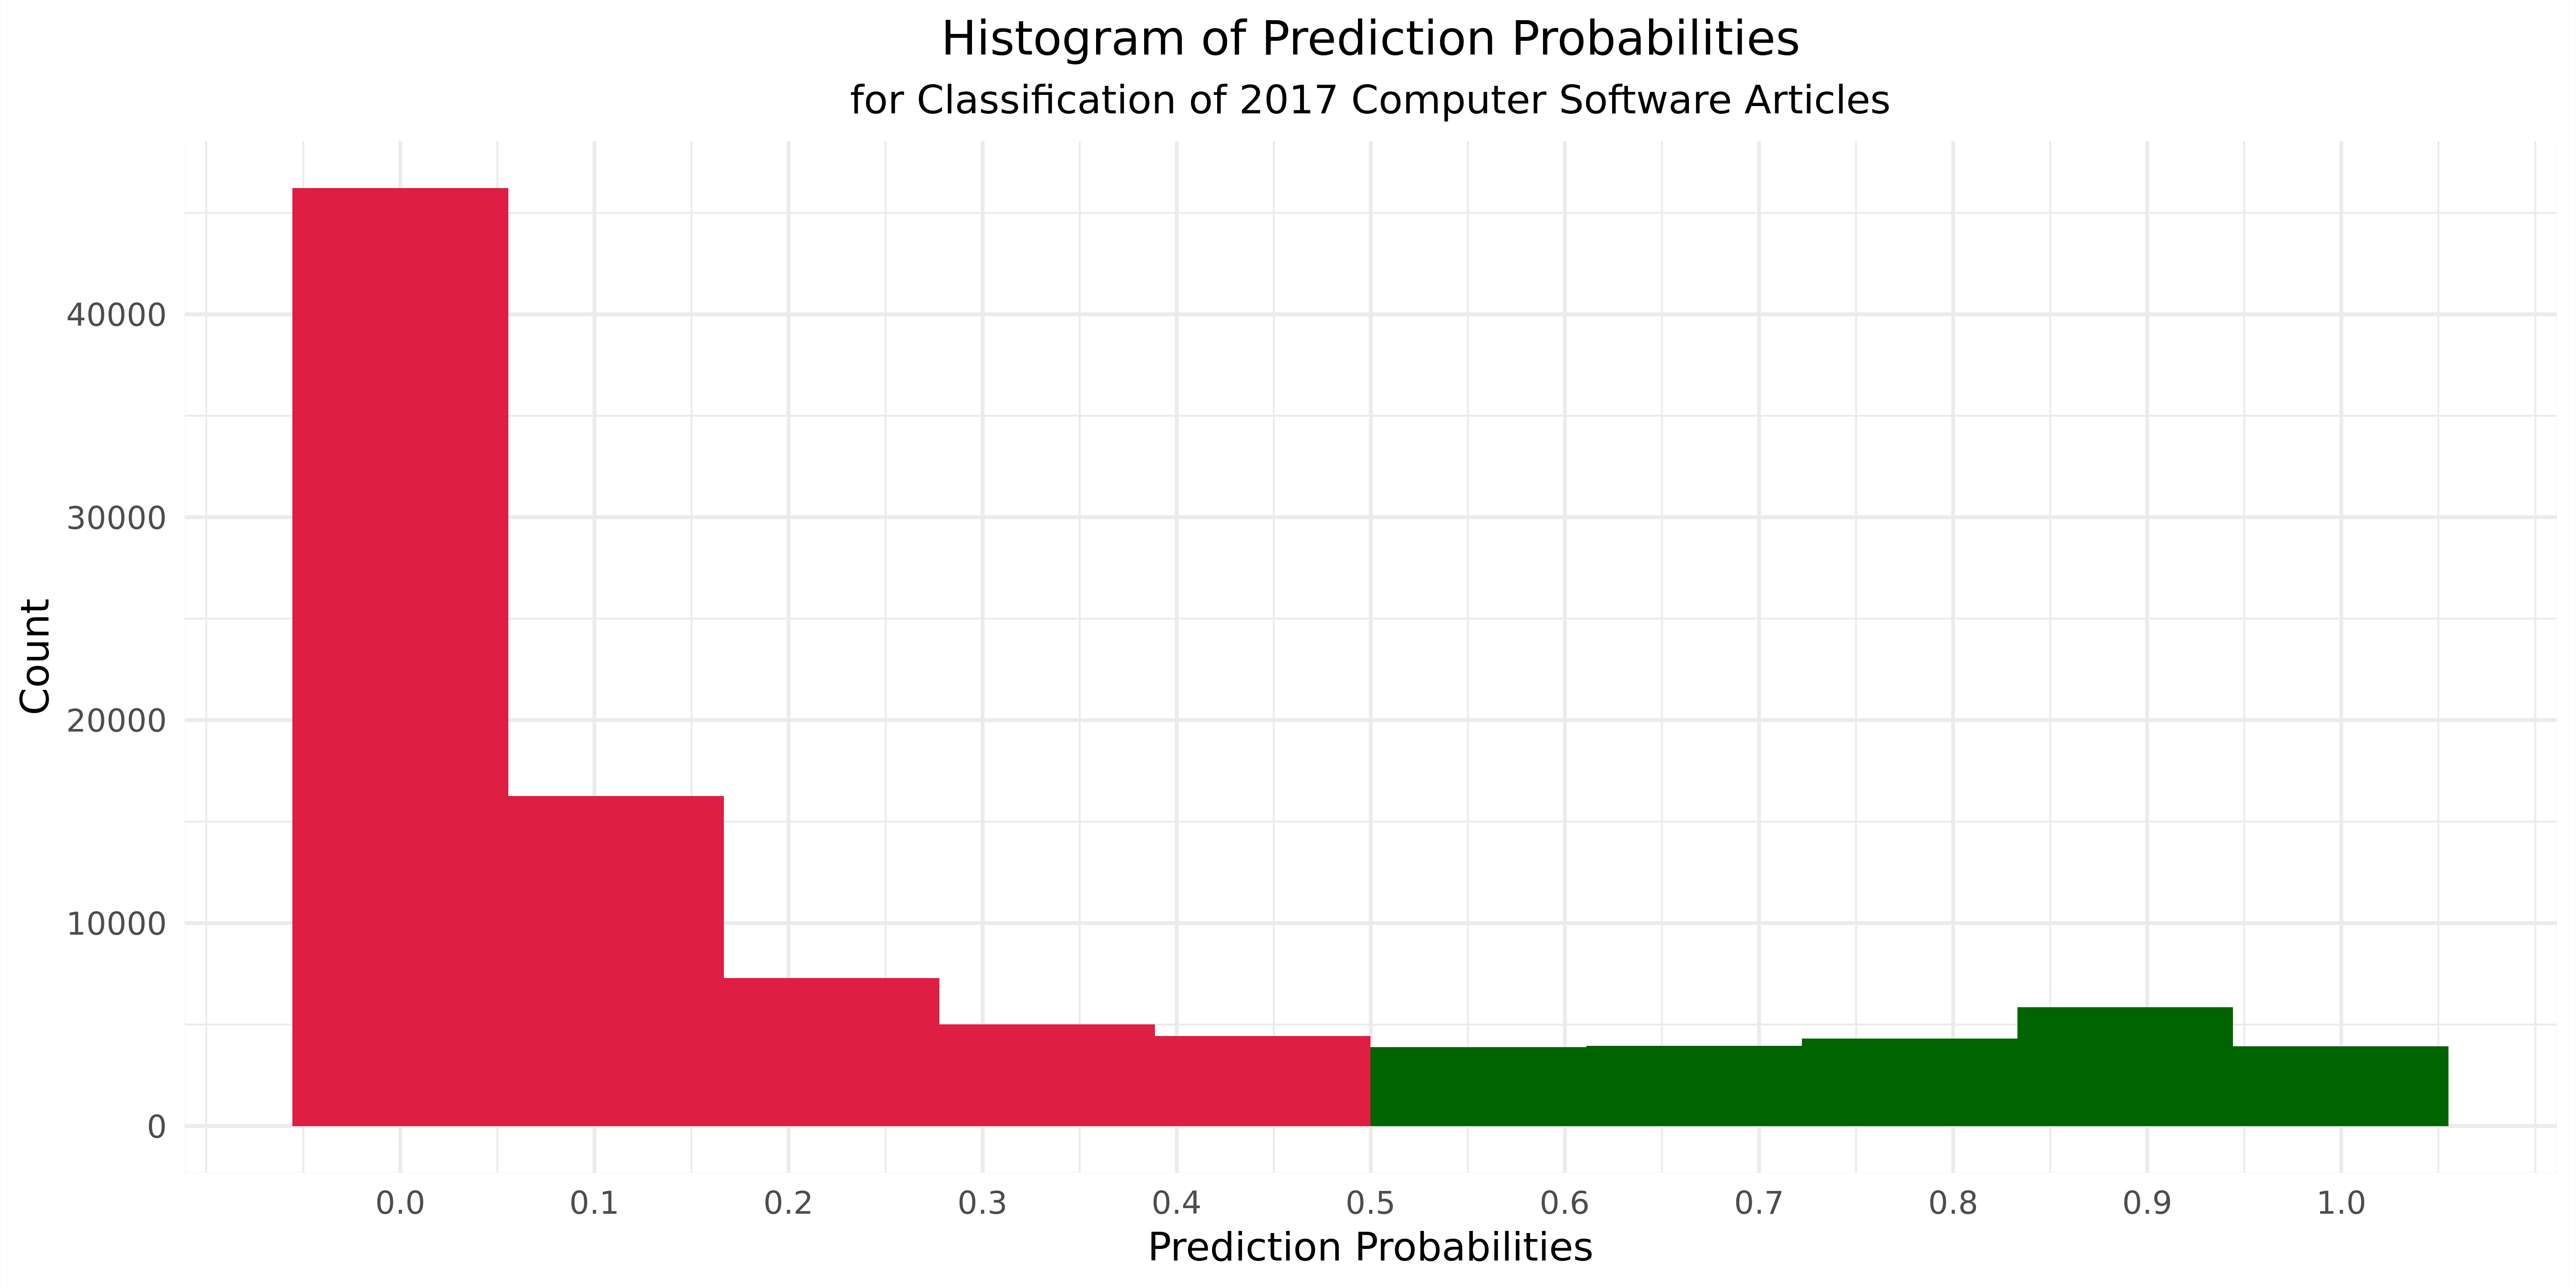
Classification of 2017 computer software articles
When our final model, the DistilBERT-SVM classifier, is applied to the 101,143 computer software articles published in 2017, it outputs the following distribution of probabilities that each one indicates innovation. Roughly 20% of the articles, or 21,916 articles are classified as describing innovation, based on our probability threshold of 0.5. It is interesting to note that our model, trained on a balanced, 50/50 dataset, still makes 80/20 predictions. This imbalance in the predictions aligns with our prior experience conducting the same work in other sectors, such as food and pharmaceuticals, where articles indicating innovation are typically rarer.
Other findings
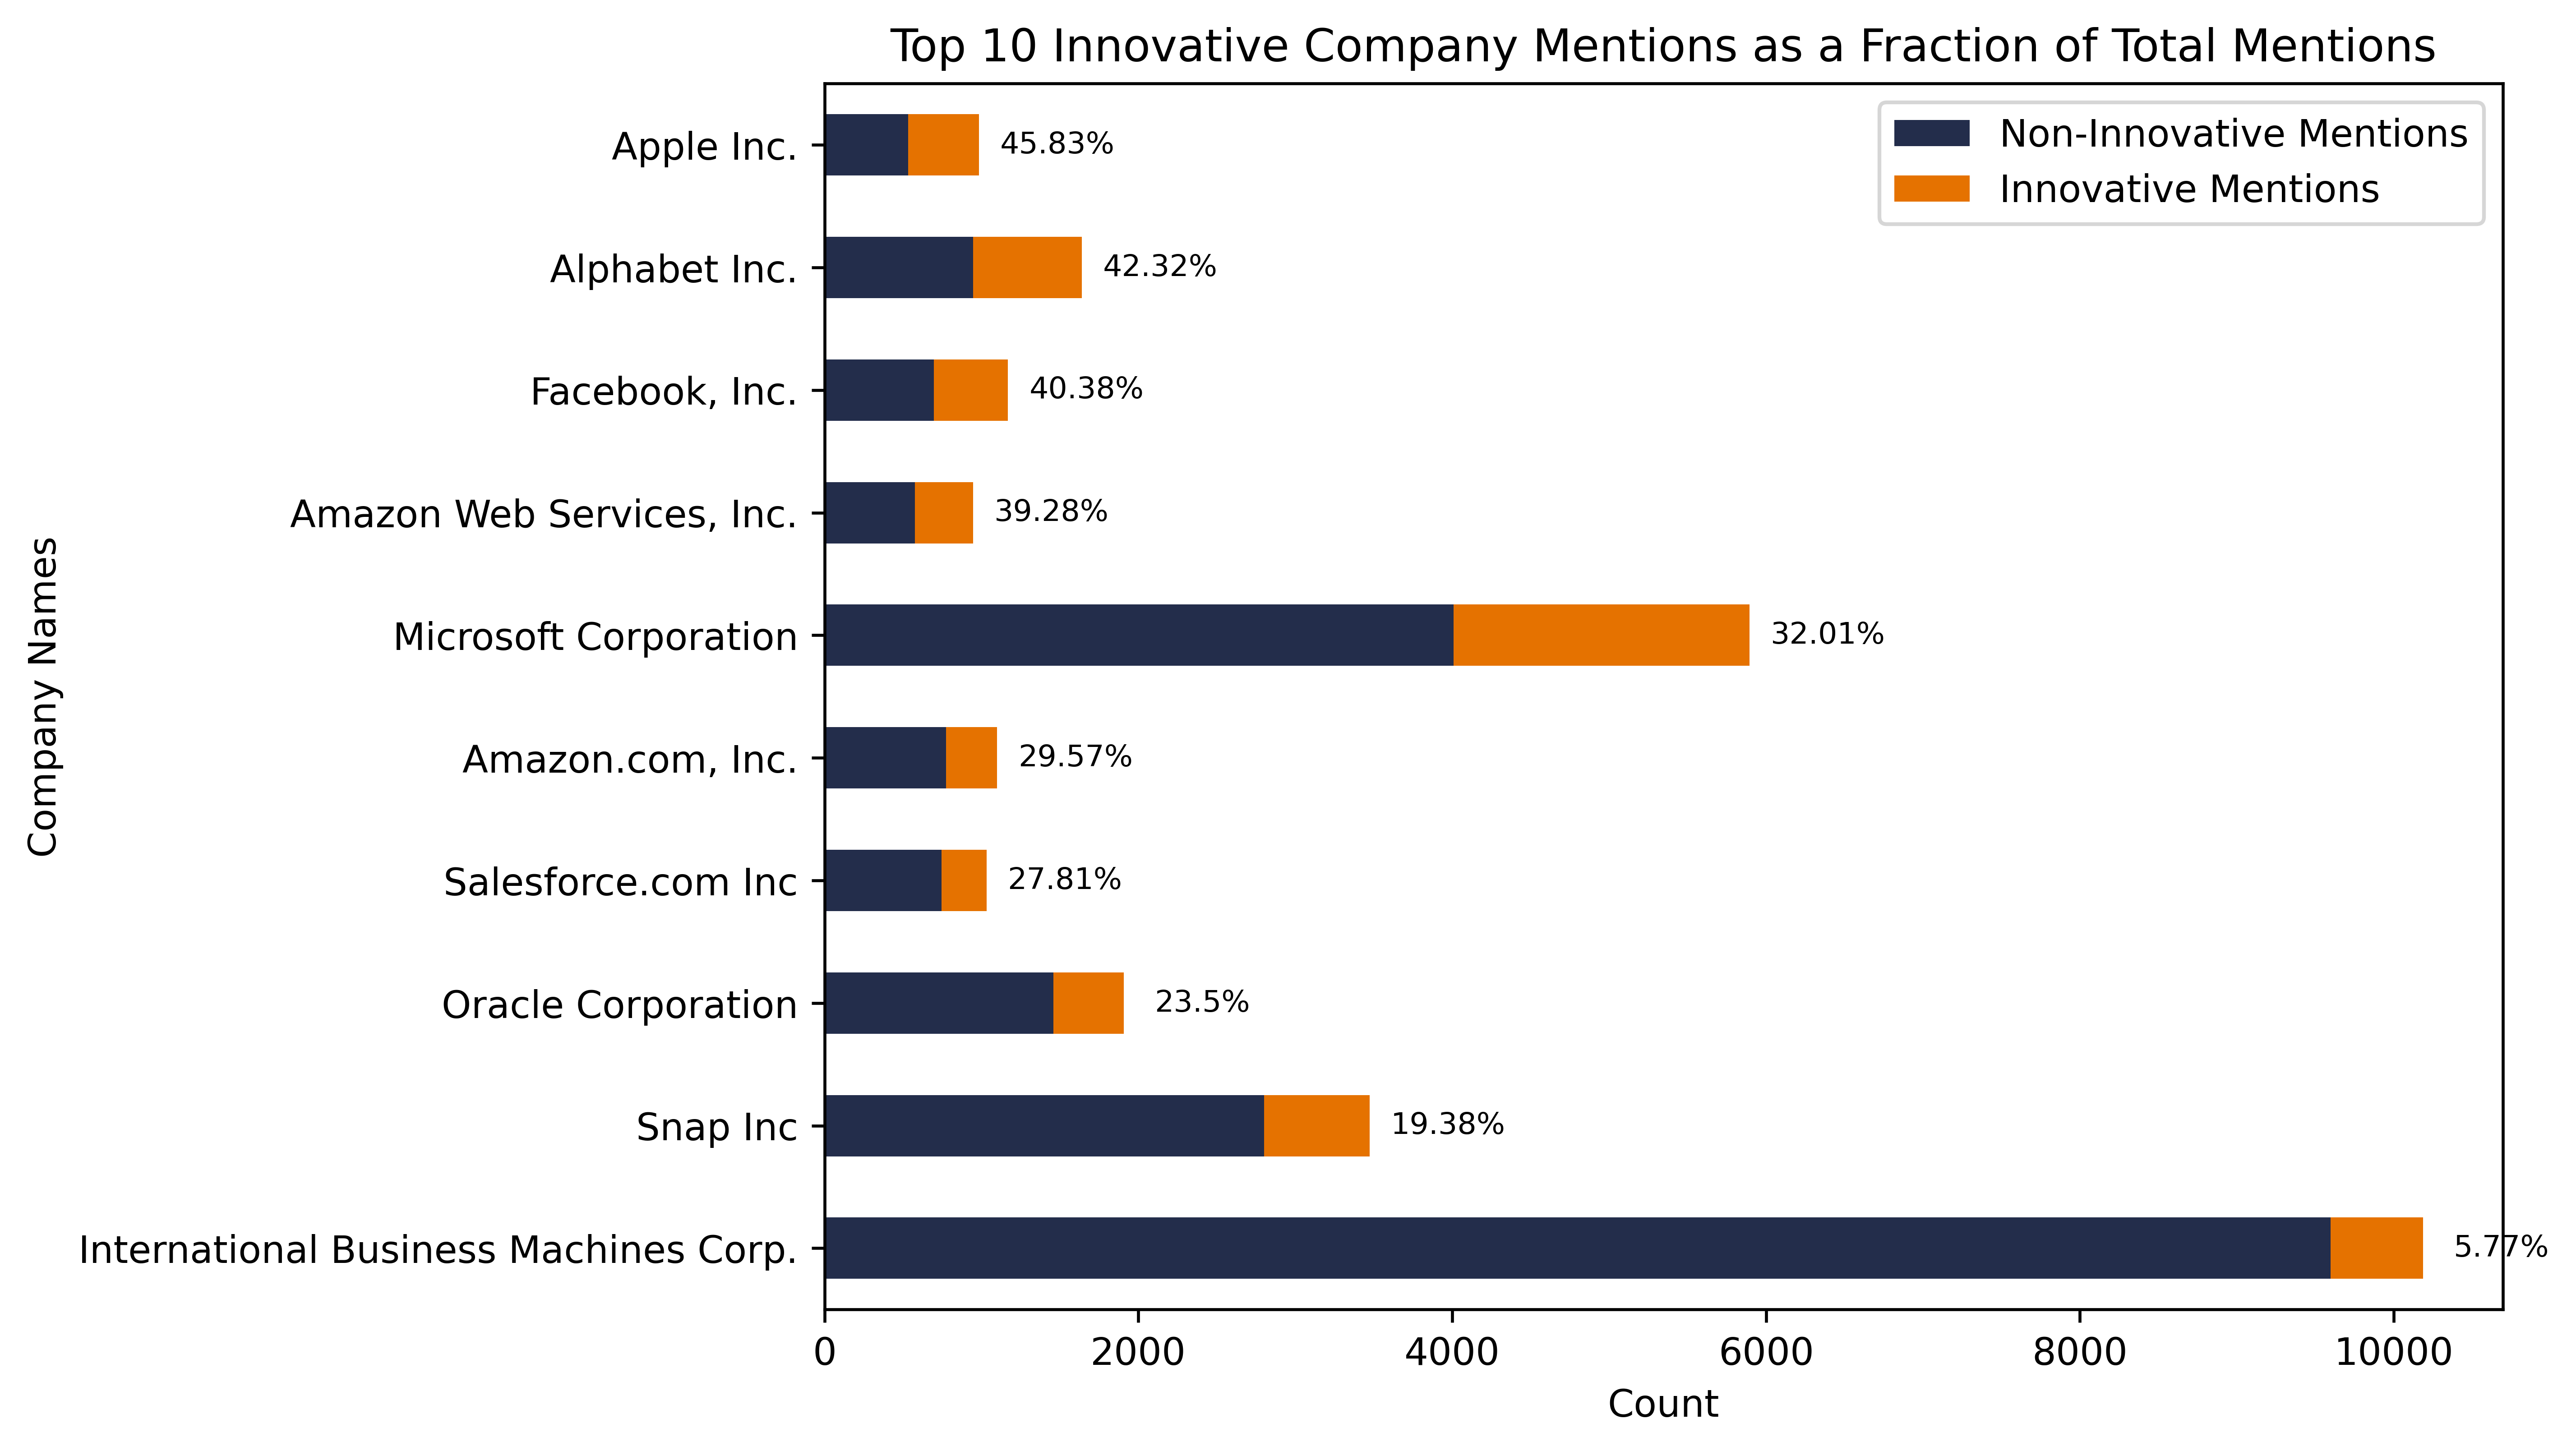
When we investigate the top innovators associated with our 20k articles describing innovation, we begin to notice a few interesting trends. First we observe that within the top 10 companies by total mention, there is huge variation in the proportion of innovation-indicating articles. Interestingly, the most mentioned company, IBM, has the smallest proportion of innovation-indicating articles. Meanwhile, Apple, Alphabet, and Microsoft have significant proportions of innovation articles. Future work may investigate what companies are best represented in news articles to better understand the kinds of innovation and new products can be detected in text.
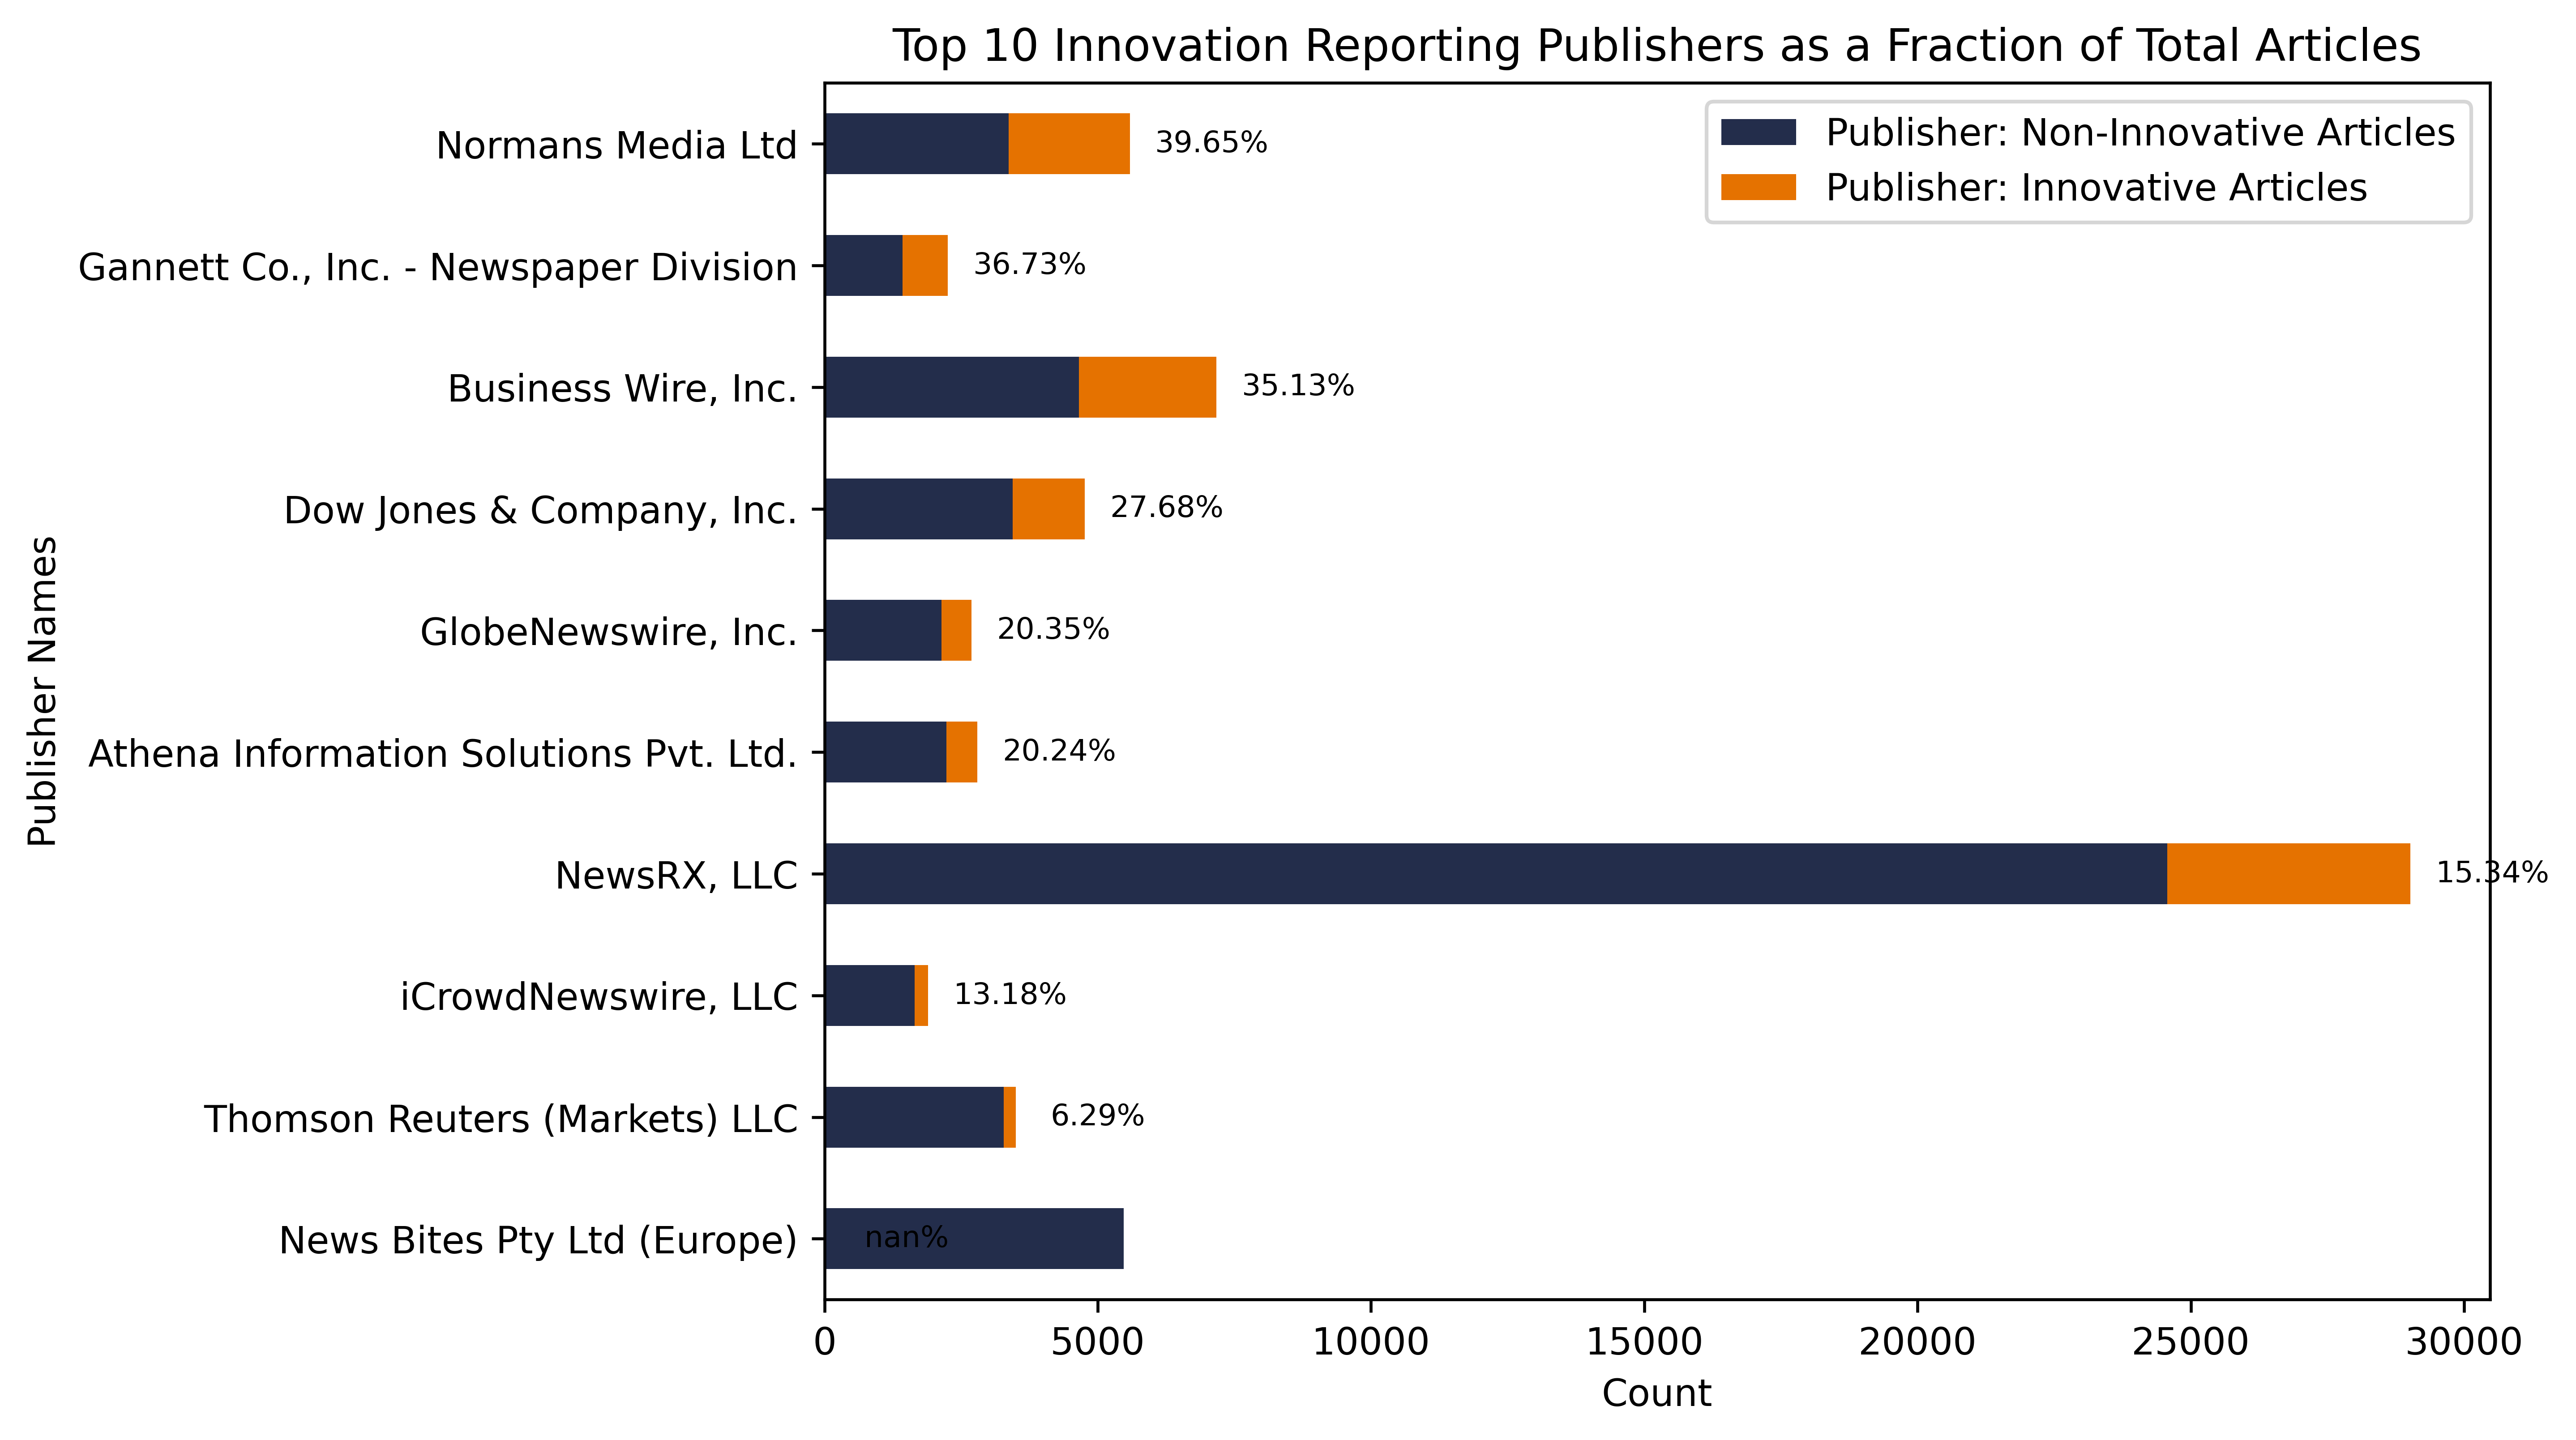
When we investigate the top publishers associated with our 20k articles describing innovation, we begin to notice a few interesting trends. The most immediate observation here is the variation in the proportion of innovation-indicating articles by publisher source. Some publishers, such as Norman's Media and Business Wire, have high proportions of innovation-indicating articles; others, like News Bites, have much lower proportions. It may be improve our model to consider eliminating those publishers who are less likely to cover new products in their publications; however, a larger set of training data would be required to better support this kind of analysis.
Conclusion
This summer’s work has yielded promising results in terms of leveraging state-of-the-art language representation models to identify articles relevant to innovation. We have successfully constructed a pipeline that classifies articles and extracts innovative companies with high accuracy and reasonable confidence. As a result of this work, our team and the NCSES team can analyze innovation patterns frequency within the computer software sector through a new, quantitative perspective. Our work allows for the comparison of innovation rates between companies, specific differences between innovation identified by BERD and by our model, and countless other lenses with which to study this data.
Our research and results are susceptible to some influence due to the nature of our data, the context of which should be considered when performing further analysis and making conclusions based on the data. This can present itself in different ways: bias may come about through disparities in companies’ PR budgets, causing them to be overrepresented in the data; irrelevant news or “noise” can filter through into the data, lowering the rate of innovation in the entire dataset; and certain publishers may be overrepresented in the media, causing them to skew company-name frequency in the dataset and results. Scaling is also a challenge within this project -- the research demands hand-labeled data prior to model application, and crossing sectors or crossing time periods will only add complexity to the project.
Building off this summer’s results, our next steps will include refining and fine-tuning our natural language processing pipeline and moving from company-name extraction into product-name extraction using named-entity recognition. We plan to look into alternate NER approaches, such as question-answering (Q&A) models (which can be tested at the demo on our “Methods” page).